Zipkin installation
Introduction
Zipkin is a distributed tracing system. It helps gather timing data needed to troubleshoot latency problems in microservice architectures. It manages both the collection and lookup of these data. Zipkin’s design is based on the Google Dapper paper.
In traditional structures there are multiple services and multiple instances communicating each other. When an exception thrown, it is required to ssh every application and their instances, search for the error message and analyze the response times of instances. In the small structure it is not a big deal but with bigger structure there is a need for central monitoring. Zipkin helps for tracing and analyzing these data.
Applications are instrumented to report timing data to Zipkin. The Zipkin UI also presents a Dependency diagram showing how many traced requests went through each application. If you are troubleshooting latency problems or errors, you can filter or sort all traces based on the application, length of trace, annotation, or timestamp. Once you select a trace, you can see the percentage of time each span takes which allows you to identify in which application slow response may have occurred. (Trace/Span terminology is very well described at the Spring Cloud Sleuth library)
Prerequisites
Default port should be available :
-
9411 (Default Zipkin instance)
A library takes care of passing tracing information between threads/libraries/context etc. should be configured in the application
-
Spring based services can use Spring Cloud Sleuth: https://cloud.spring.io/spring-cloud-sleuth
-
Java based services can useBrave: https://github.com/openzipkin/brave
System requirements
In the basic setup, Zipkin comes without any requirements, since data is stored in memory. Zipkin provides some extensions, which may introduce some requirements
Following docker-compose contains an example of detailed integration;
-
Configure Apiomat Microservices for tracing (Please take a look at the general service configuration to see, how the Zipkin URI has to be configured.)
-
Sleuth is used in microservices for tracing
-
Zipkin URL is configured
-
100% sampling configured which sends every data to Zipkin (Sampling is provided by Sleuth so less percentage of data could be sent to Zipkin for performance reasons)
-
-
-
Additionally Zipkin is configured with Grafana and Prometheus, official example can be found here
-
Zipkin is configured with MySQL persistence
-
Grafana and Prometheus is added.
-
Prometheus gathers stats from applications where Zipkin supports it.
-
Grafana is used for displaying metrics and Zipkin officially has pre-configured dashboard and datasource for Grafana.
-
-
Script given here should exist relative folder in the below compose file. These scripts adds a datasource and configured dashboard to Grafana.
-
Installation
Zipkin is not included in our installation package and must be installed separately. Follow the instructions from Zipkin directly.
# Docker logindocker login -u <USERNAME> -p <PASSWORD># Store the following file and execute:docker-compose -f aom-zipkin.compose upversion: '3.5'services:# Configure Yambas and mongodb mongo: image: mongo:3.4 command: --smallfiles yambas: image: apiomat/yambas:3.4.1 ports: - "8081:8081" environment: common_hosts_admin: http://localhost:8081 common_hosts_live: http://localhost:8000 common_hosts_staging: http://localhost:8000 common_hosts_test: http://localhost:8000 common_isEnterpriseInstallation: "true" yambas_configEncryptionKey: '<encryptionkey>' common_consul_url: http://consul:8500 common_consul_health_port: 8081 yambas_mongodb_hosts_default: mongo:27017 yambas_license_key: <licensekey> spring_zipkin_baseUrl: http://zipkin:9411 spring.cloud.consul.host: consul depends_on: - mongo - consul# Configuring zipkin via offical doc: https://github.com/openzipkin/zipkin/blob/master/docker/examples/docker-compose.yml storage: image: openzipkin/zipkin-mysql container_name: mysql zipkin: image: openzipkin/zipkin container_name: zipkin environment: - STORAGE_TYPE=mysql - MYSQL_HOST=mysql ports: - 9411:9411 depends_on: - storage dependencies: image: openzipkin/zipkin-dependencies entrypoint: crond -f environment: - STORAGE_TYPE=mysql - MYSQL_HOST=mysql - MYSQL_USER=zipkin - MYSQL_PASS=zipkin depends_on: - storage prometheus: container_name: prometheus image: prom/prometheus ports: - 9090:9090 depends_on: - storage volumes: # Map where you saved from example: https://github.com/openzipkin/zipkin/tree/master/docker/examples/prometheus - ./prometheus/prometheus.yml:/etc/prometheus/prometheus.yml grafana: container_name: grafana image: grafana/grafana ports: - 3000:3000 depends_on: - prometheus environment: - GF_AUTH_ANONYMOUS_ENABLED=true - GF_AUTH_ANONYMOUS_ORG_ROLE=Admin setup_grafana_datasource: image: appropriate/curl container_name: setup_grafana_datasource depends_on: - grafana volumes: # Map where you saved from example: https://github.com/openzipkin/zipkin/tree/master/docker/examples/prometheus - ./prometheus/create-datasource-and-dashboard.sh:/create.sh:ro command: /create.sh# Adding service disocovery(consul) and gateway(dispatcher) microservices consul: image: library/consul ports: - 8500:8500 command: agent -dev -ui -client=0.0.0.0 dispatcher: image: apiomat/dispatcher:1.0.1 environment: SPRING_CLOUD_CONSUL_HOST: consul SPRING_CLOUD_CONSUL_PORT: 8500 spring.zipkin.baseUrl: http://zipkin:9411 spring.sleuth.sampler.probability: 1 ports: - "8000:8000" depends_on: - consulvolumes: mongoData:Configuration
Configuration are described in the Zipkin extensions site for each extension.
Environmental Variables
The following variables are mentioned in the docker compose file above for Zipkin; for further configuration using docker you can refer to Zipkin docker configuration.
|
Key |
Default |
Explanation |
|
STORAGE_TYPE |
mysql |
Mysql used in the above compose. More options can be found here |
|
MYSQL_HOST |
mysql |
Configures Mysql host, defaults to localhost |
The following variables are mentioned in the docker compose file above for Microservices tracing solution (Spring Cloud Sleuth); for further configuration using docker you can refer to Spring Cloud Sleuth configuration.
|
Key |
Default |
Explanation |
|
spring.zipkin.baseUrl |
Configures Zipkin URL. Defaults to localhost:9411 |
|
|
spring.sleuth.sampler.probability |
1 |
Configures tracing rate sending to Zipkin. Default is 0.1 which is 10%. |
Next steps
After running above compose, first sent a simple request to yambas via dispatcher:
curl -v --location --request GET 'localhost:8000/yambas/rest/apps/{appName}/Models/Basics/User' \--header 'x-apiomat-apikey: {APIKEY}' \-u {yourUserName}:{yourPassword}Go to http://localhost:9444/zipkin and search for newest traces:
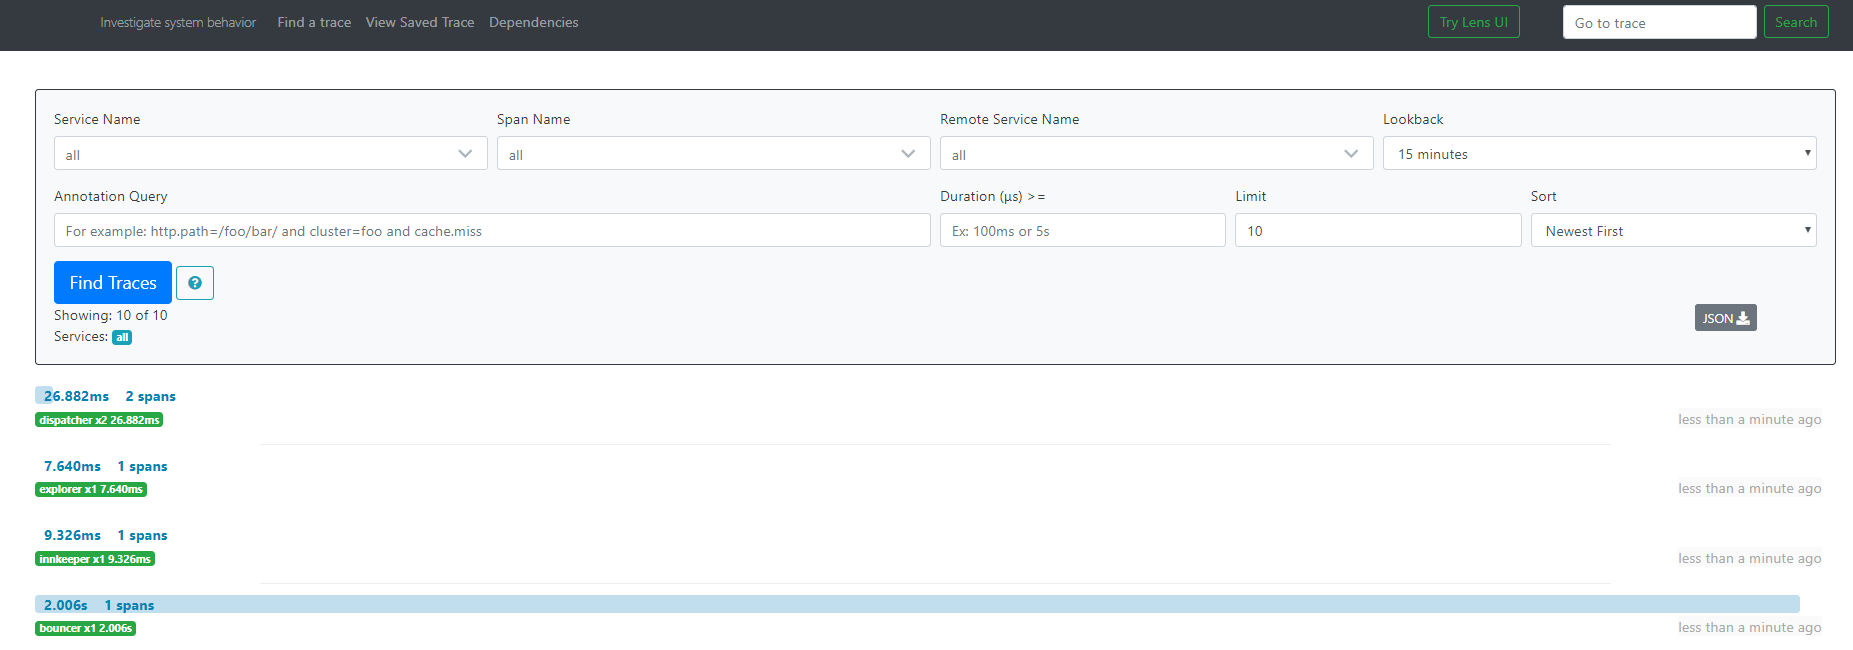
Click on the dispatcher trace. In this page Zipkin shows every service and instance hit by your initial request. First it arrives at Dispatcher than it makes request to Yambas. Click on Dispatcher to see its details:

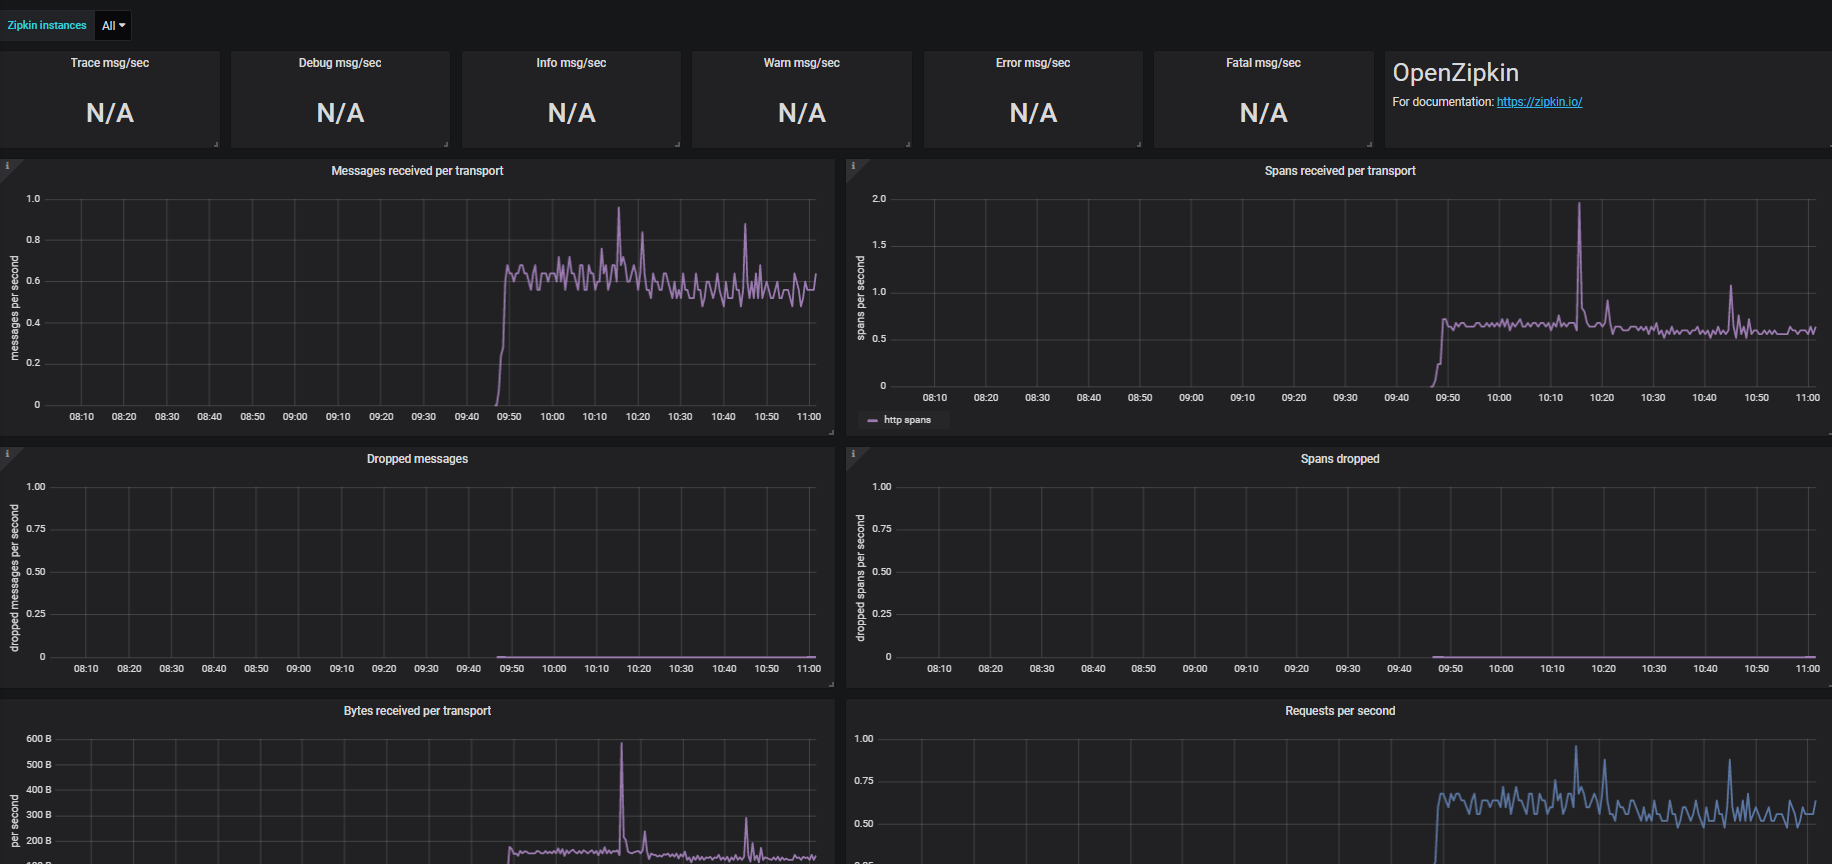
Also in the above example compose, Prometheus and Grafana is also configured (you can also configure other solutions, in this example we stick with official example). Go to Grafana dashboard on http://localhost:3000
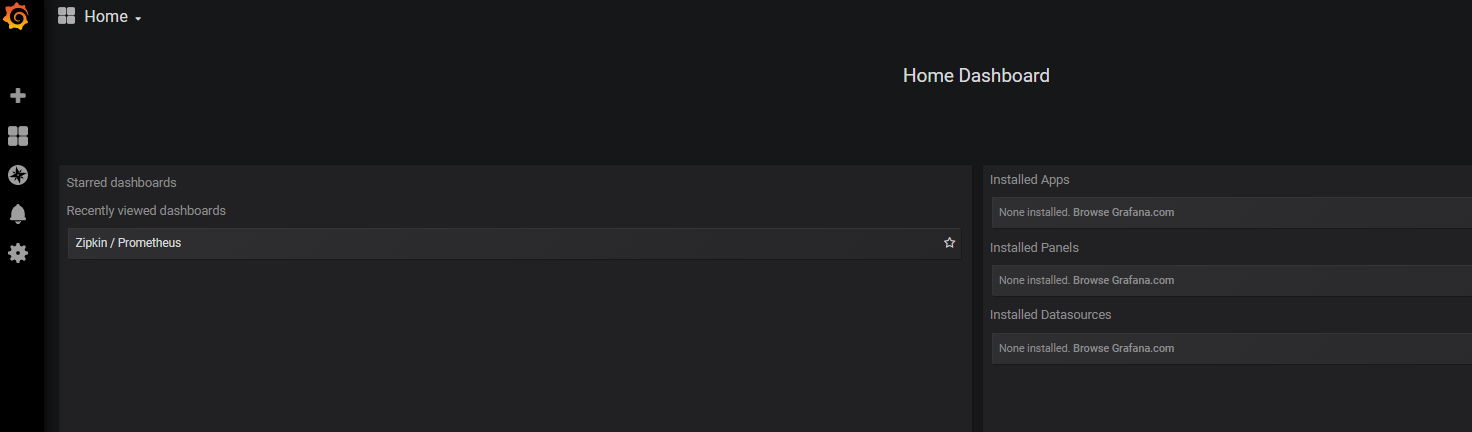
Select Zipkin/Prometheus Dashboard. This is pre-configured dashboard with example metrics. You can edit/extend/set alarms and keep track of Zipkin metrics here: