[Graylog] installation
Introduction
Graylog is a industry leading log monitoring solution used by ApiOmat to manage logging from Yambas and all other services in a centralized application. Graylog allows real-time log analysis and customize log monitoring. Form more information abount graylog, visit https://www.graylog.org.
Prerequisites
Following default ports should be available :
-
9000 (Default Graylog instance)
-
12201 (Default GELF TCP & UDP input port)
-
514 (Default Syslog TCP & UDP input port)
System requirements
(Taken from http://docs.graylog.org/en/2.4/pages/installation.html#system-requirements)
The following configurations are recommended.
-
Some modern Linux distribution (Debian Linux, Ubuntu Linux, or CentOS recommended)
-
MongoDB 2.4 or later (latest stable version is recommended)
Graylog prior to 2.3 does not work with Elasticsearch 5.x!
Graylog 2.4
does not
work with Elasticsearch 6.x yet!
Installation
Graylog is not included in our installation package and must be installed separately. Follow the instructions from Graylog directly.
# Docker logindocker login -u <USERNAME> -p <PASSWORD># Store the following file and execute:docker-compose -f aom-graylog.compose upaom-graylog.compose:
version: '3.5'services: graylog: image: graylog/graylog:3.0 ports: - "9000:9000" - "12201:12201" - "12201:12201/udp" - "514:514" - "514:514/udp" depends_on: - elasticsearch - mongo - consul links: - elasticsearch - mongo - consul environment: - GRAYLOG_PASSWORD_SECRET=somepasswordpepper - GRAYLOG_ROOT_PASSWORD_SHA2=8c6976e5b5410415bde908bd4dee15dfb167a9c873fc4bb8a81f6f2ab448a918 - GRAYLOG_WEB_ENDPOINT_URI=http://127.0.0.1:9000/api elasticsearch: image: elasticsearch:5.6.12 environment: - http.host=0.0.0.0 - transport.host=localhost - network.host=0.0.0.0 - xpack.security.enabled=false - ES_JAVA_OPTS=-Xms512m - -Xmx512m bootstrapper: image: apiomat/bootstrapper:1.0.0-nightly depends_on: - consul - graylog links: - consul - graylog consul: image: library/consul ports: - "18500:8500" command: agent -dev -ui -client=0.0.0.0 mongo: image: mongo:3.4 ports: - "27017:27017" command: --smallfiles yambas: image: apiomat/yambas:3.2.0-nightly ports: - "8081:8081" environment: common_hosts_admin: http://localhost:8081 common_hosts_live: http://localhost:8000 common_hosts_staging: http://localhost:8000 common_hosts_test: http://localhost:8000 common_isEnterpriseInstallation: "true" yambas_configEncryptionKey: '<encryptionkey>' common_consul_url: http://consul:8500 common_consul_health_port: 8081 GRAYLOG_HOST: graylog LOG4J_LEVEL_APIOMAT: info LOG4J_LEVEL_MONGODB: info LOG4J_LEVEL_JERSEY: info LOG4J_LEVEL_HAZELCAST: info yambas_mongodb_hosts_default: mongo:27017 yambas_license_key: <licensekey> depends_on: - mongo - consul - graylog links: - mongo - consul - graylogConfiguration
Configuration are described in the Graylog installation wiki for each system.
Environmental Variables
The following variables are mentioned in the docker compose file above; for further configuration using docker you can refer to Graylog docker configuration.
|
Key |
Default |
Explanation |
|
GRAYLOG_PASSWORD_SECRET |
somepasswordpepper |
|
|
GRAYLOG_ROOT_PASSWORD_SHA2 |
8c6976e5b5410415bde908bd4dee15dfb167a9c873fc4bb8a81f6f2ab448a918 |
Encoded root password (default is admin) |
|
GRAYLOG_WEB_ENDPOINT_URI |
http://127.0.0.1:9000/api |
Web endpoint to access graylog api (for more information about graylog rest api you can refer to Graylog rest api documentation) |
To enable sending logs to Graylog you should have a logback.xml configuration to your service (Graylog host is defined as "graylog" assuming you are running your services in a docker container on the same network):
<?xml version="1.0" encoding="UTF-8"?><configuration> <springProperty name="serviceName" source="spring.application.name"/> <include resource="org/springframework/boot/logging/logback/base.xml" /> <!-- send logs to graylog --> <appender name="GELF" class="de.siegmar.logbackgelf.GelfUdpAppender"> <graylogHost>graylog</graylogHost> <graylogPort>12201</graylogPort> <layout class="de.siegmar.logbackgelf.GelfLayout"> <includeRawMessage>false</includeRawMessage> <includeMarker>true</includeMarker> <includeMdcData>true</includeMdcData> <includeCallerData>true</includeCallerData> <includeRootCauseData>true</includeRootCauseData> <includeLevelName>true</includeLevelName> <shortPatternLayout class="ch.qos.logback.classic.PatternLayout"> <pattern>%m%nopex</pattern> </shortPatternLayout> <fullPatternLayout class="ch.qos.logback.classic.PatternLayout"> <pattern>%m</pattern> </fullPatternLayout> <staticField>service_name:${serviceName}</staticField> <staticField>os_arch:${os.arch}</staticField> <staticField>os_name:${os.name}</staticField> <staticField>os_version:${os.version}</staticField> </layout> </appender> <logger name="perfStatsLogger" level="WARN"> <appender-ref ref="GELF" /> </logger>
Authentication setup
Default authentication on Graylog dashboard is "admin":"admin". To log in, go to your Graylog endpoint (default http://localhost:9000) and simply enter the admin credentials:
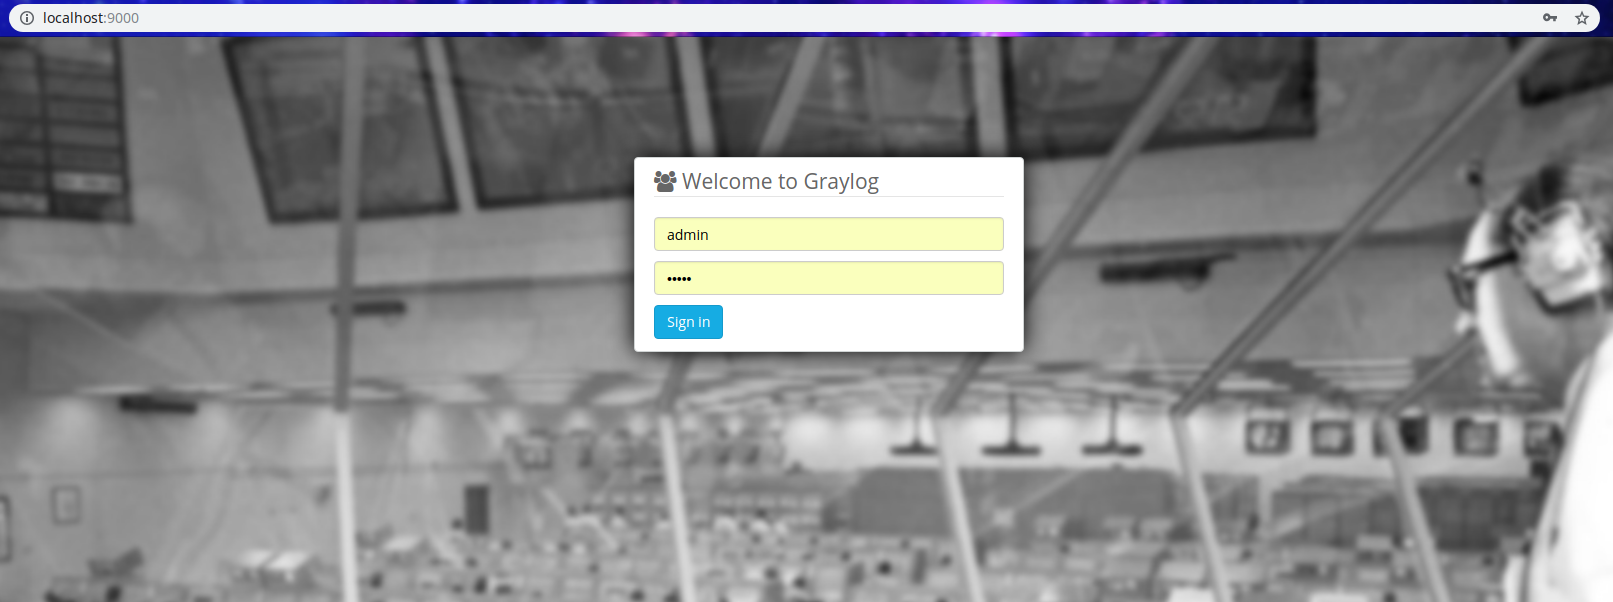
You can read more about Graylogs security at the official documentation.
Next steps
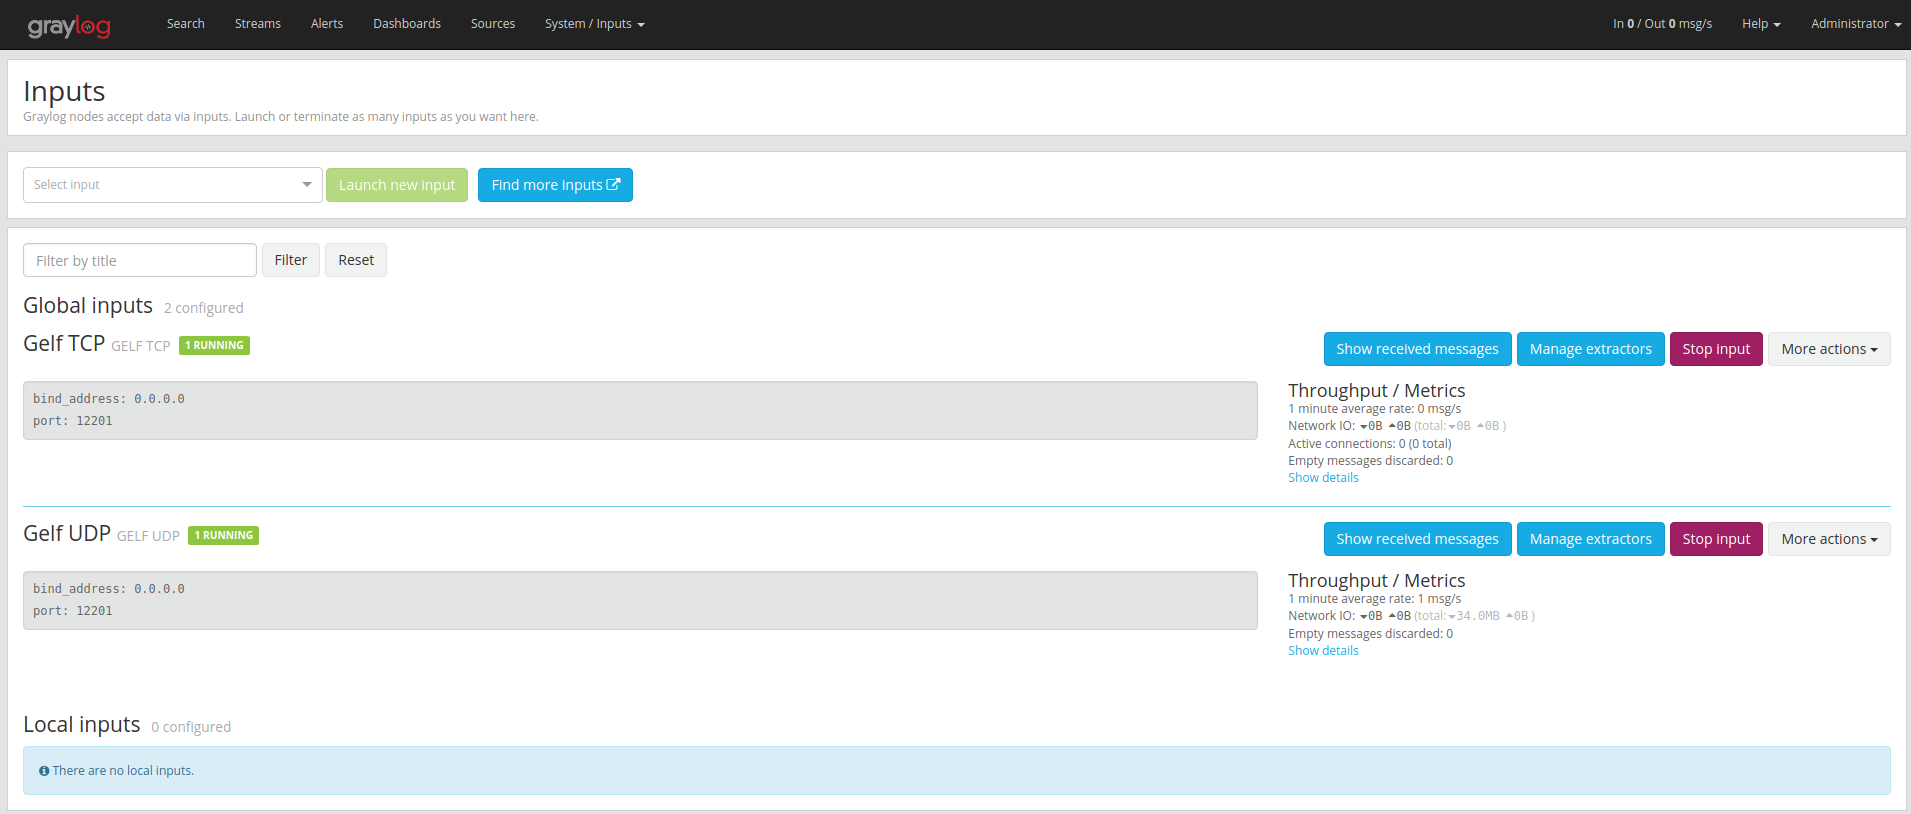
Connect to the log manager as describe in Authentication part. When using docker, bootstrapper service should have created two different input on port 12201 for GELF TCP & UDP ( using tabs, navigate to "System/Inputs" > "inputs") :
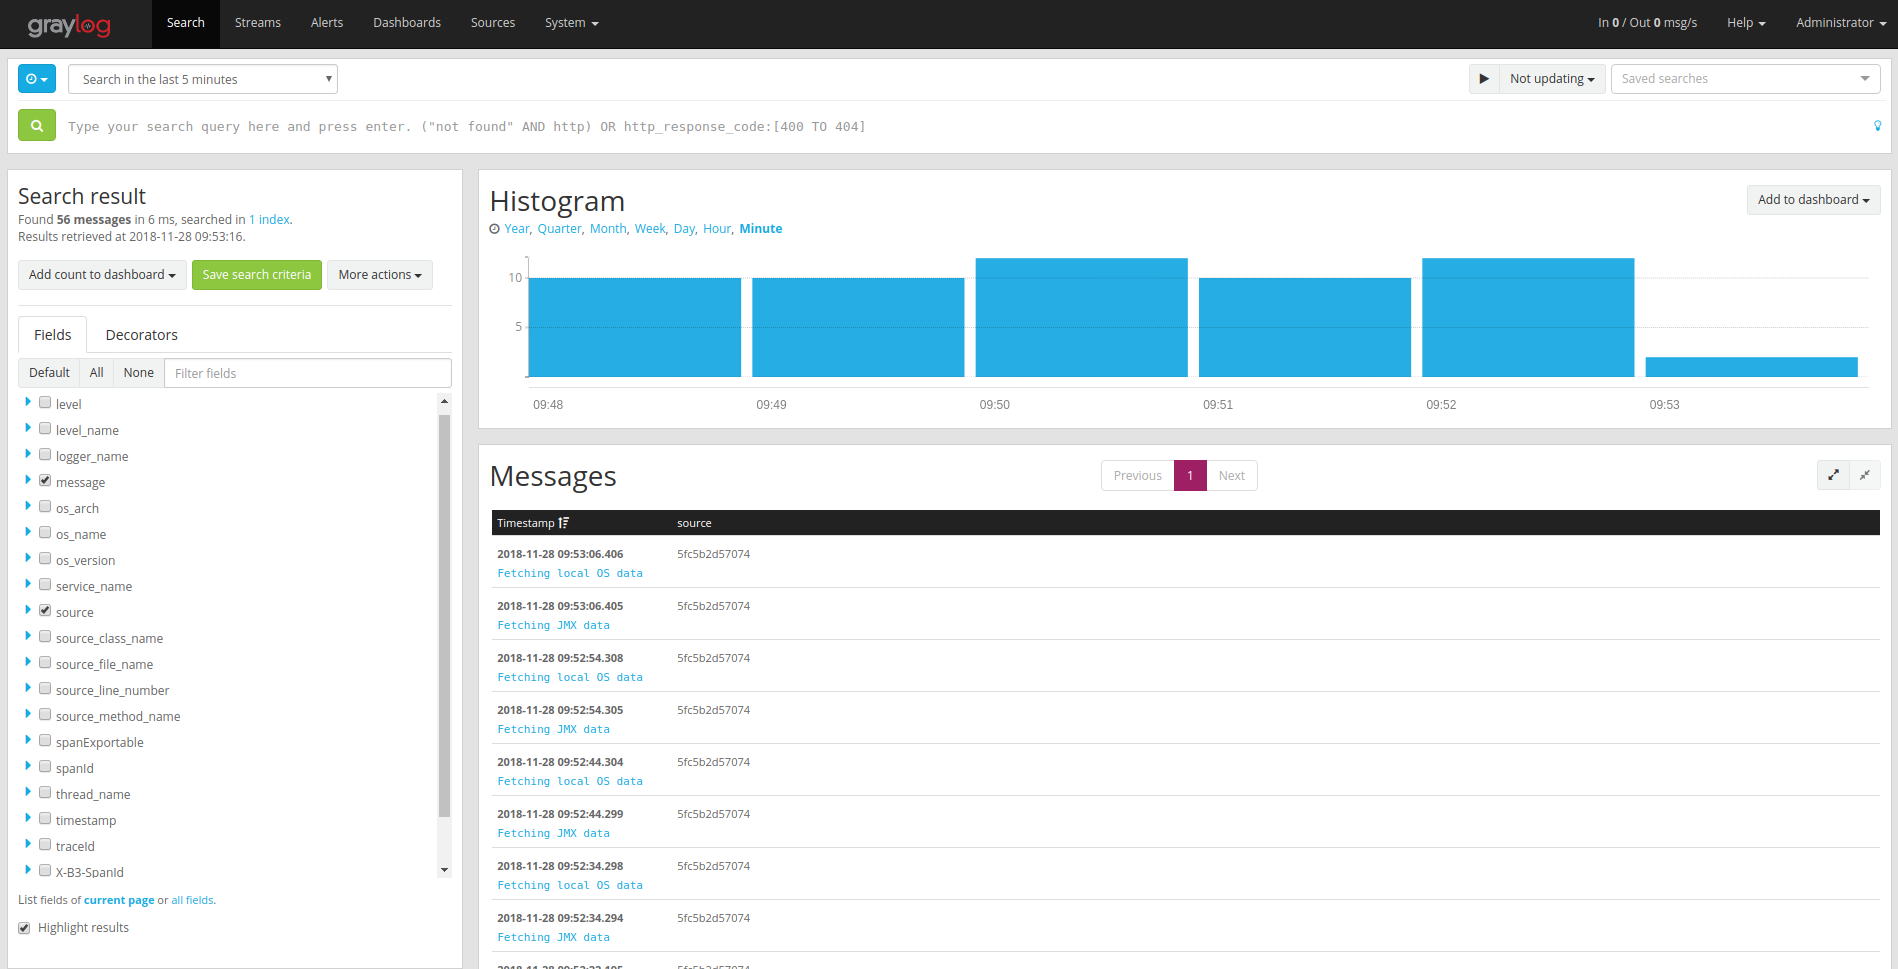
Once your inputs configured, and services started, you can now search and manage your logs navigating using the "Search tab", or you can click the "Show received messages" of an input to see the log received on that specific input. Default input used by services is UDP port 12201. You should now be able to filter the log :