Zipkin Installation
Introduction
Zipkin is a distributed tracing system. It helps gather timing data needed to troubleshoot latency problems in microservice architectures. It manages both the collection and lookup of these data. Zipkin’s design is based on the Google Dapper paper.
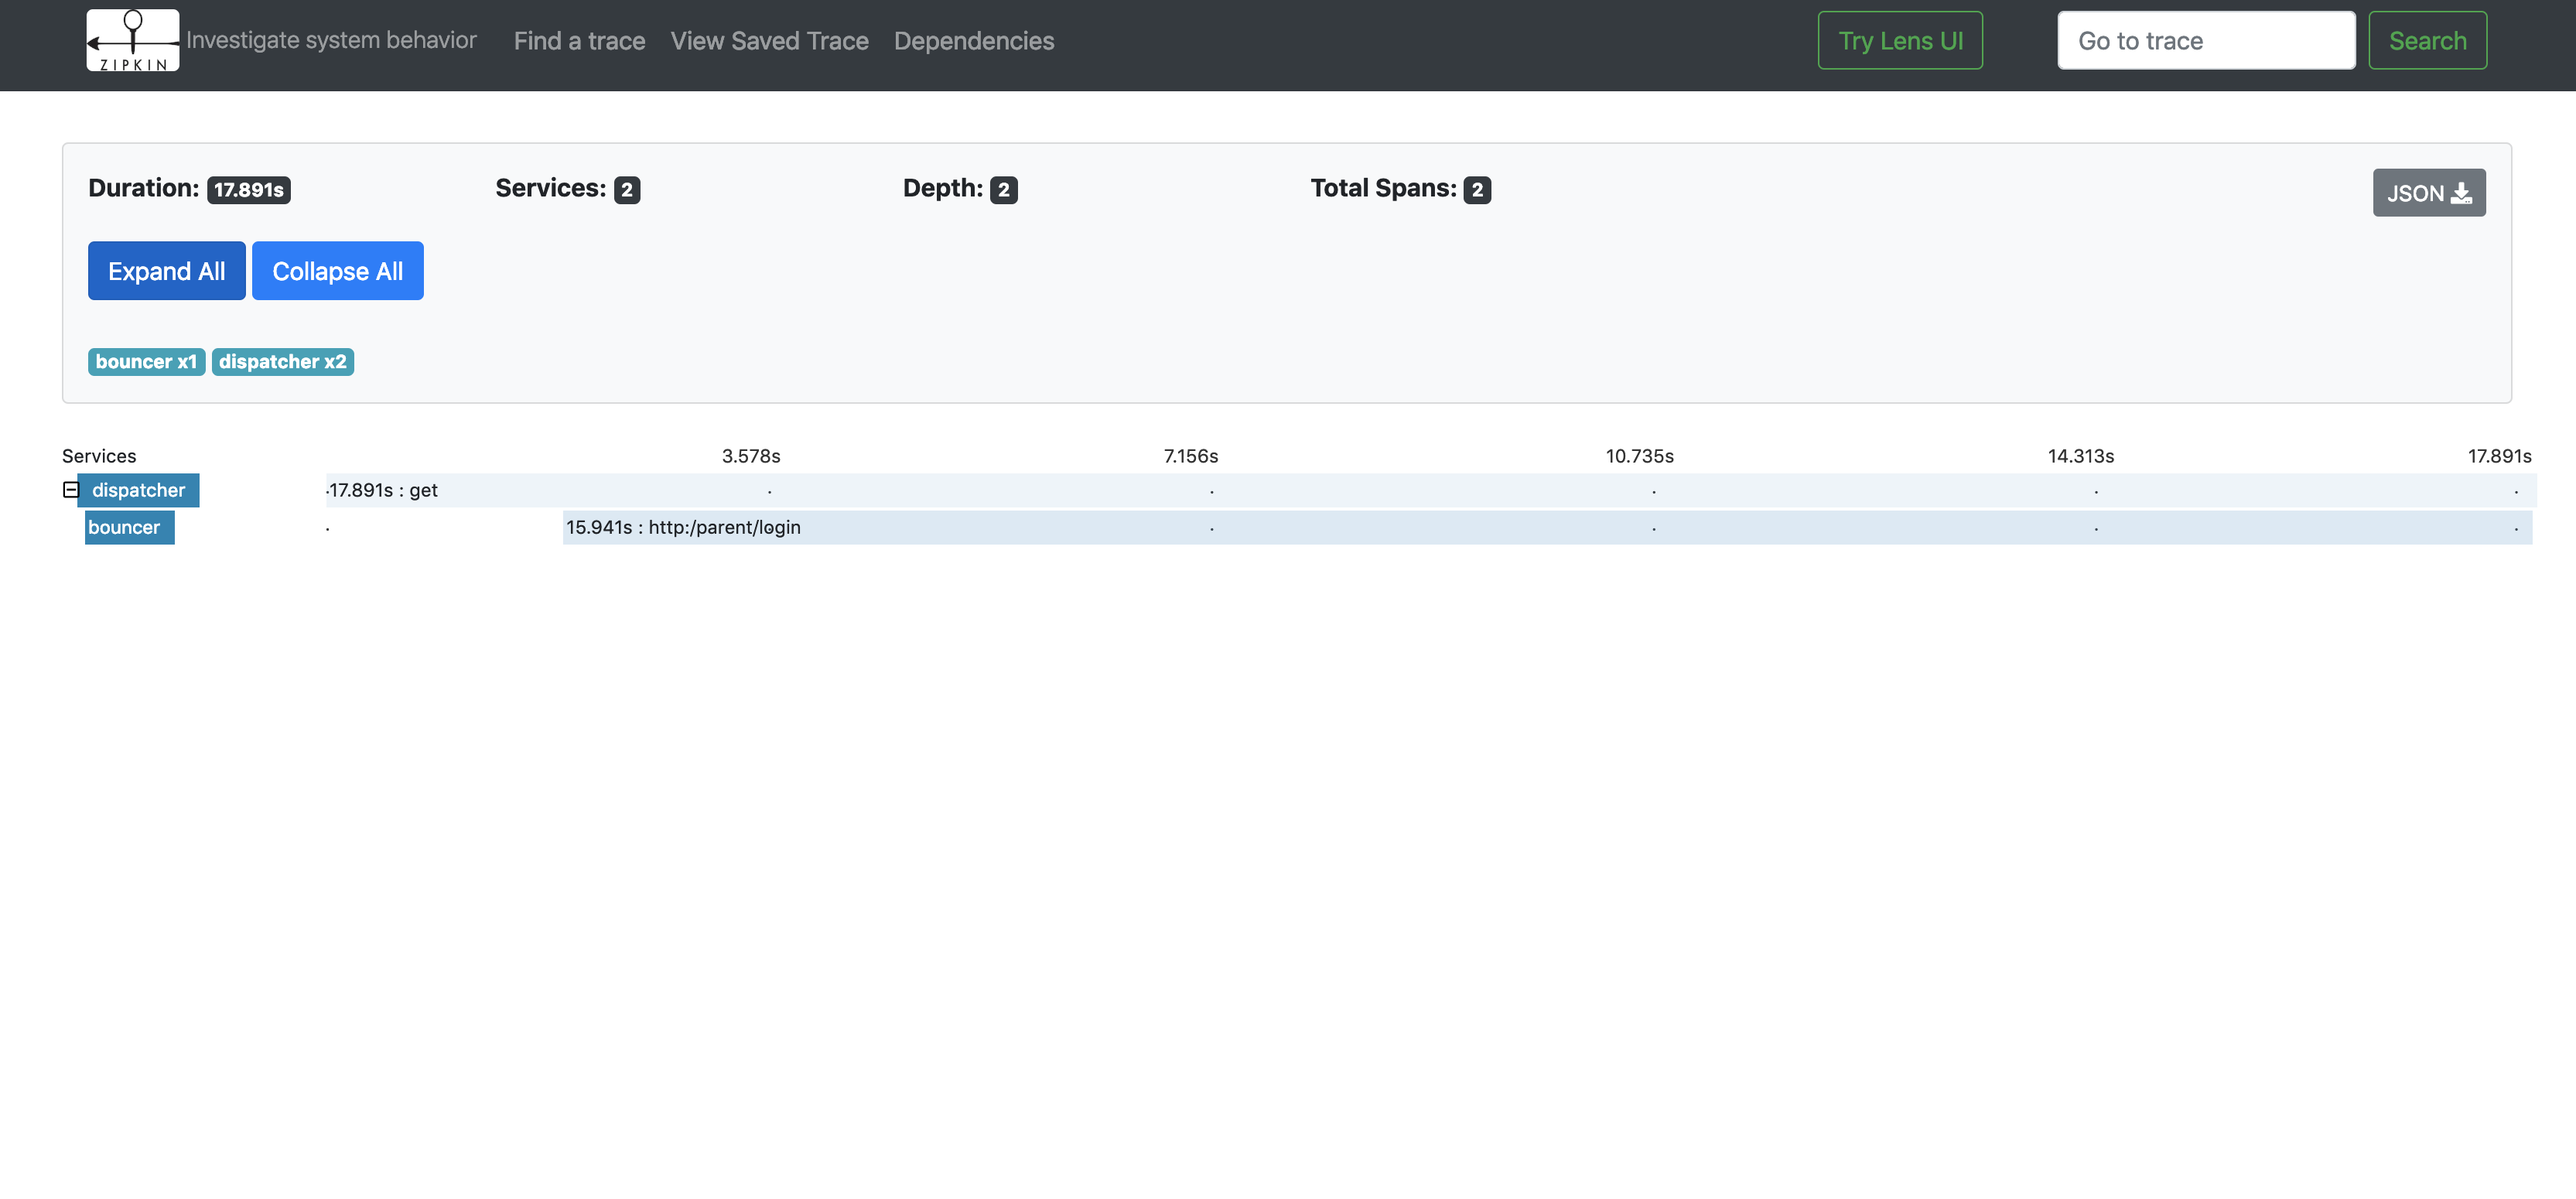
Applications are instrumented to report timing data to Zipkin. The Zipkin UI also presents a Dependency diagram showing how many traced requests went through each application. If you are troubleshooting latency problems or errors, you can filter or sort all traces based on the application, length of trace, annotation, or timestamp. Once you select a trace, you can see the percentage of time each span takes which allows you to identify in which application slow response may have occurred.
Prerequisites
Default port should be available :
-
9411 (Default Zipkin instance)
System requirements
In the basic setup, Zipkin comes without any requirements, since data is stored in memory. Zipkin provides some extensions, which may introduce some requirements: https://zipkin.io/pages/extensions_choices.html
Installation
Zipkin is not included in our installation package and must be installed separately. Follow the instructions from Zipkin directly.
# Docker logindocker login -u <USERNAME> -p <PASSWORD># Store the following file and execute:docker-compose -f aom-zipkin.compose upversion: '3.5'services: zipkin: image: openzipkin/zipkin container_name: zipkin ports: - 9411:9411 consul: image: library/consul ports: - "18500:8500" command: agent -dev -ui -client=0.0.0.0 mongo: image: mongo:3.4 command: --smallfiles gateway: image: apiomat/dispatcher:1.0.0-nightly ports: - "8000:8000" command: --spring.cloud.consul.host=consul --spring.zipkin.baseUrl=http://zipkin:9411 --spring.sleuth.sampler.probability=1 --endpoints.health.sensitive=false --management.security.enabled=false links: - consul - zipkin # Some example services from ApiOmat bouncer: image: apiomat/bouncer:1.0.0-nightly command: --spring.cloud.consul.host=consul --spring.zipkin.baseUrl=http://zipkin:9411 --spring.sleuth.sampler.percentage=1 ports: - "8095:8095" links: - consul - zipkin apidocs: image: apiomat/explorer:1.1.0-nightly command: --spring.cloud.consul.host=consul --spring.zipkin.baseUrl=http://zipkin:9411 --spring.sleuth.sampler.probability=1 links: - consul - zipkin yambas: image: apiomat/yambas:3.3.0-nightly ports: - "8081:8081" environment: common_hosts_admin: http://localhost:8081 common_hosts_live: http://localhost:8000 common_hosts_staging: http://localhost:8000 common_hosts_test: http://localhost:8000 common_isEnterpriseInstallation: "true" yambas_configEncryptionKey: '<encryptionkey>' common_consul_url: http://consul:8500 common_consul_health_port: 8081 yambas_mongodb_hosts_default: mongo:27017 yambas_license_key: <licensekey> SPRING_CLOUD_CONSUL_HOST: consul DEBUG_PORT: 9111 spring_zipkin_baseUrl: http://zipkin:9411 depends_on: - mongo - consul - zipkin links: - mongo - consul - zipkinConfiguration
Configuration are described in the Zipkin extensions site for each extension.
The docker examples above do not need any configuration. For further configuration using docker you can refer to Zipkin docker configuration.
Next steps
ApiOmat services are equipped with libraries sending traces and spans to Zipkin. The terminology is very well described at the Spring Cloud Sleuth library: https://cloud.spring.io/spring-cloud-sleuth/single/spring-cloud-sleuth.html#_terminology
Please note that each service has to be configured with the URl of the Zipkin instance, because it has to know where to send the traces to. By default, the Zipkin instance is expected to run at http://localhost:9411. Please take a look at the general service configuration to see, how the Zipkin URI has to be configured.