Monitoring
ApiOmat provides monitoring capabilities at all layers. For most methods, a Nagios compartible monitoring system is required.
Checking the YAMBAS service
After running, each application server provides a simple ping-like REST method to check if the service is alive (usable for load balancers, etc):
http(s)://YOURHOST/yambas/rest
YAMBAS will respond with a version number.
Furthermore, it is recommended that you create a simple app for monitoring, storing some sample data in it and use a REST call to test if data is retrieved properly.
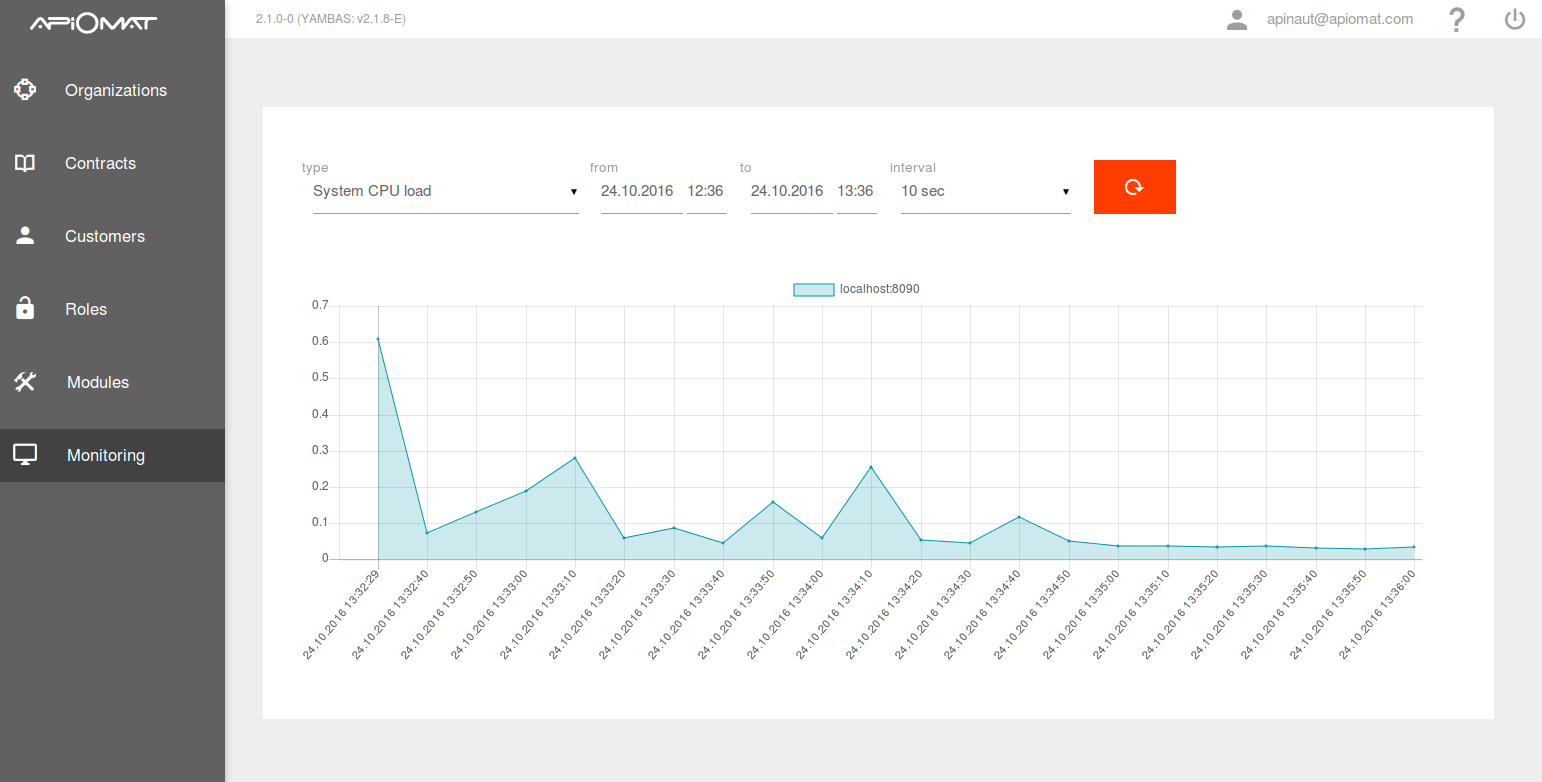
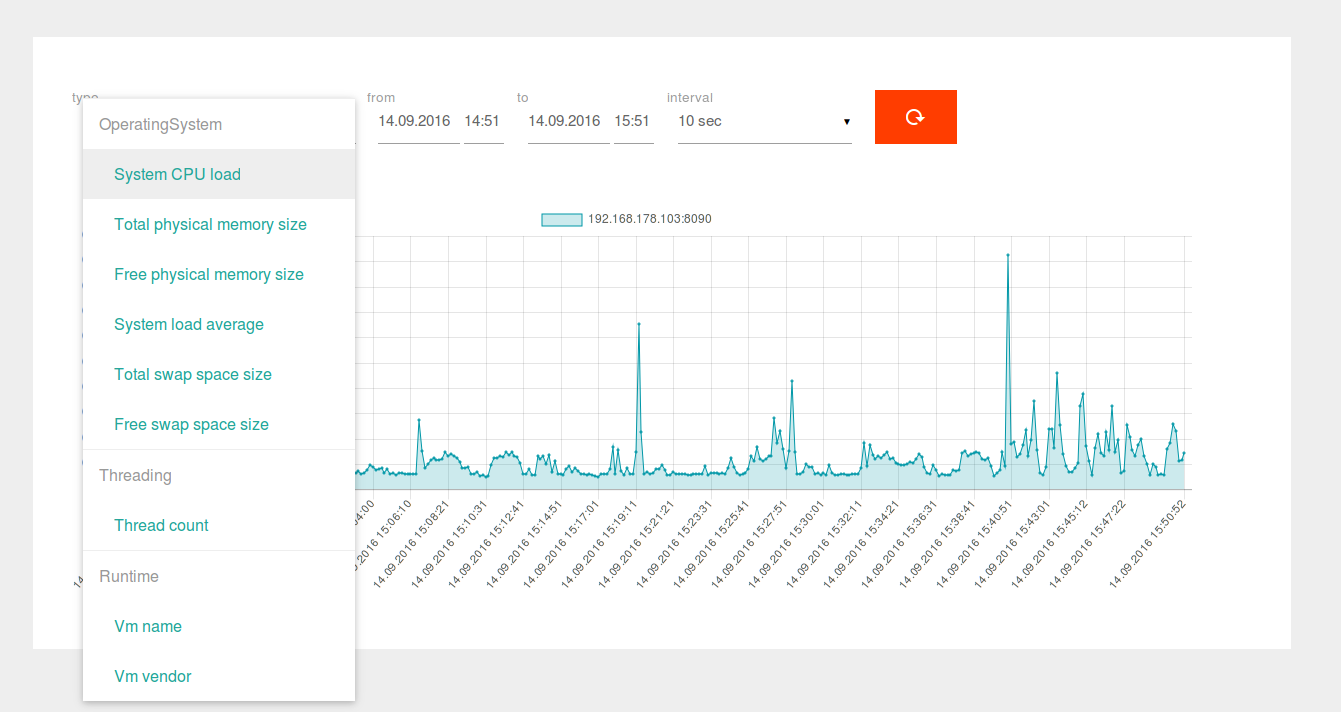
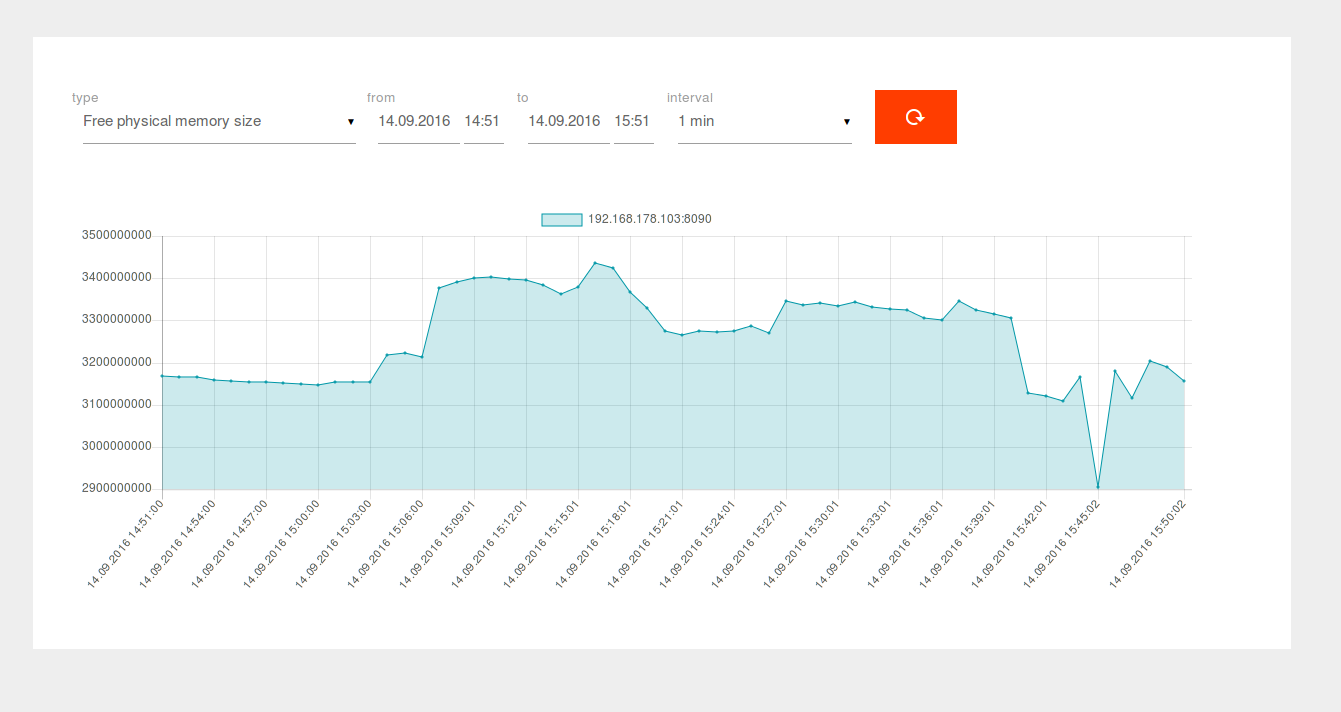
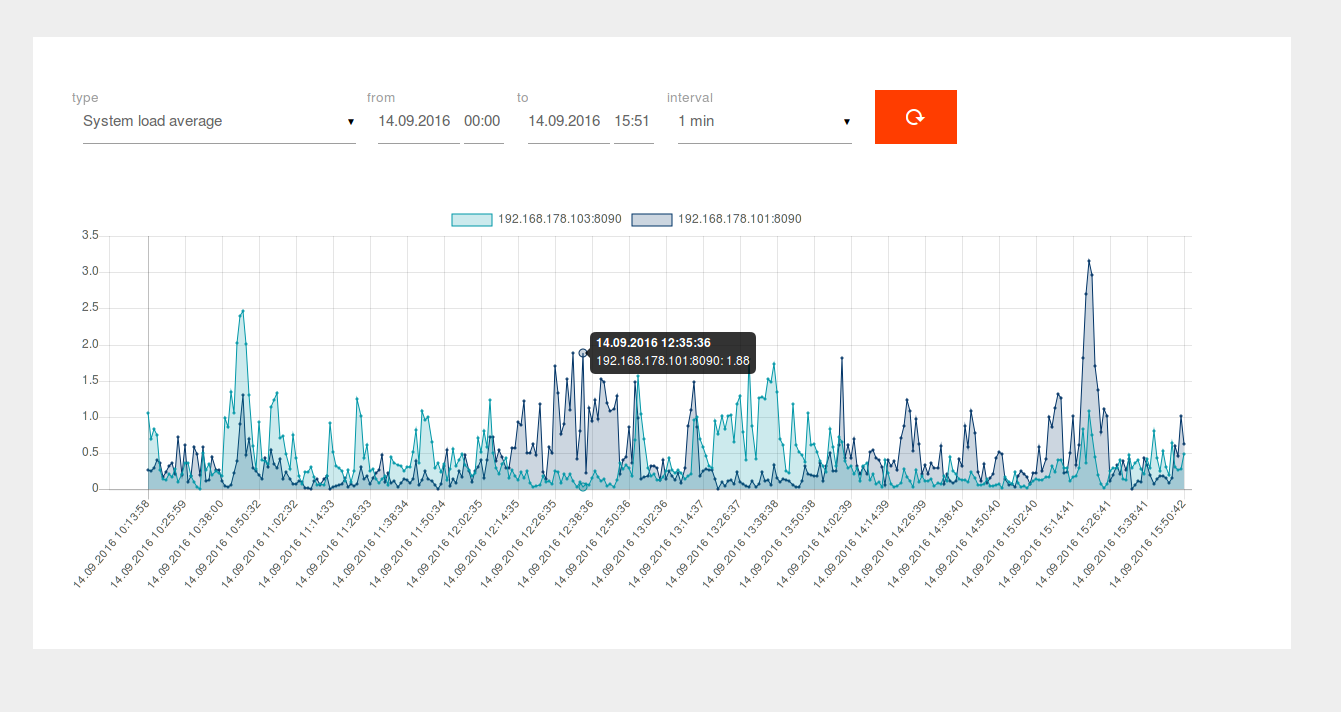
Monitoring via ApiOmat Dashboard
Using the ApiOmat Dashboard to monitor your servers is an easy way to get an overview on different aspects of your servers like CPU and RAM usage (see screenshots). Only the SuperAdmin has access to the monitoring page.
-
configure apiomat.yaml:
apiomat.yaml monitoring settingsmonitoring:# URL of the service registryeurekaHost: http://localhost:8761monitoringUser: user# Use the same password as configured for monitoring servicemonitoringPassword: secretWhen the monitoring settings are configured in the yambas.conf, the option "Monitoring" is automatically added to the dashboard menu in the admin panel:
-
log into ApiOmat Dashboard with the SuperAdmin Account and open the monitoring page
A restart of yambas or dashboard is not necessary.
More about running the monitoring service can be found here.
Examples
Checking the Apache Tomcat
The jolokia plugin monitors the status of the application container. Several parameters of a web application can be observed, like
-
track the number and rate of in coming requests per second
-
number of current connections
or common checks like memory and CPU usage of the whole Tomcat.
The plugin requires Jolokia and the agent plugin on the monitored server. Jolokia works with JMX.
Checking the MongoDB
MongoDB has its own Nagios/Check_MK plugin ( check_mk_active-mongodb) where e.g.
-
replication data
-
number of connections
-
current lock
-
database size
can be monitored.
Furthermore, mongo contains several command line tools to check performance and load: http://docs.mongodb.org/manual/administration/monitoring/