Logging and Debugging
Logging
Logging framework
The default logging frameworks used in ApiOmat services are SLF4J and Logback. More information about these frameworks can be found on
the SLF4J site
and
the Logback site
.
You can define an SLF4J logger for your class by using
org.slf4j.LoggerFactory
to get an implementation of the abstract
org.slf4j.Logger
:
import org.slf4j.Logger;import org.slf4j.LoggerFactory;...public MyClass { private static final Logger LOGGER = LoggerFactory.getLogger( MyClass.class );}The org.slf4j.Logger implementation is provided by the Logback framework. You can then use the logger to print a log message at a specific logging level (e.g. DEBUG):
final String messageToPrint = "msg";LOGGER.debug( "My message {}", msg );
We recommend using the logger formatter (curly brackets) as shown above, as it checks the log level before doing any String operations and handles String concatenation more efficiently, making it more efficient in terms of time and CPU usage.
To check the enabled log level when not using the formatter, do this (e.g. checking if DEBUG is enabled):
if( LOGGER.isDebugEnabled( ) ) { LOGGER.debug( "My logged message." );}
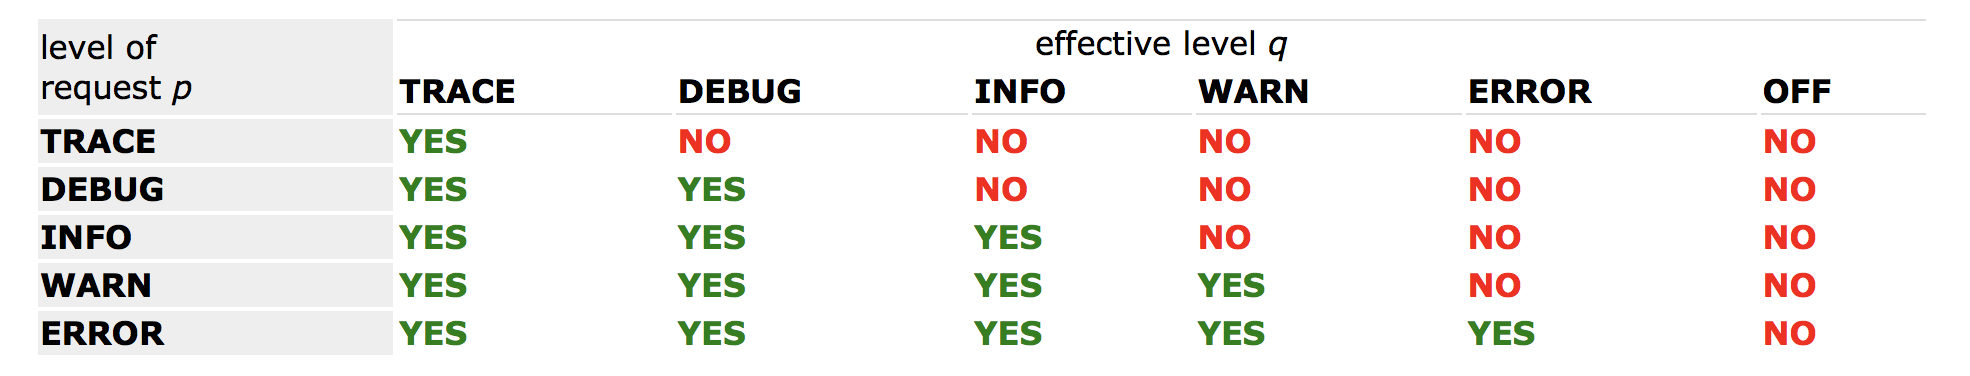
Note that the messages outputted by your application depends on the level they were logged at and the level that has been set for your application: When you set a specific log level for your application, all messages of that level or higher are logged, and all messages of a lower level are not.
For example, setting your application to the INFO level will result in all messages of the INFO, WARN and ERROR levels being logged.
The following levels are available (from the Logback architecture manual ):
Unlike native modules, services do not send their logs to the Dashboard log console. See Service Limitations .
Configuration
The default Logback configuration file is src/main/resources/logback.xml.
You can use the property logging.config to set an external logging configuration file location, e.g.: logging.config=file:/my/path/resources/logback.xml. See the common service configurations page for more details.
In this configuration, you can define specific log appenders and configure the logging level and used appender of your loggers. To dive deeper into Logback architecture and configuration, have a look at this guide to Logback.
Graylog
You may want to use Graylog to manage the logs of all of your applications from a single UI. To install and set up Graylog, refer to our
Graylog installation guide
.
Graylog support is added to your application via the GELF Logback dependency:
<dependency> <groupId>de.siegmar</groupId> <artifactId>logback-gelf</artifactId></dependency>And can be enabled by configuring the GELF appender in your logback.xml, which is commented out by default (make sure that graylogHost and graylogPort correspond to your setup!):
<appender name="GELF" class="de.siegmar.logbackgelf.GelfUdpAppender"> <graylogHost>localhost</graylogHost> <graylogPort>12201</graylogPort> <layout class="de.siegmar.logbackgelf.GelfLayout"> <includeRawMessage>false</includeRawMessage> <includeMarker>true</includeMarker> <includeMdcData>true</includeMdcData> <includeCallerData>true</includeCallerData> <includeRootCauseData>true</includeRootCauseData> <includeLevelName>true</includeLevelName> <shortPatternLayout class="ch.qos.logback.classic.PatternLayout"> <pattern>%m%nopex</pattern> </shortPatternLayout> <fullPatternLayout class="ch.qos.logback.classic.PatternLayout"> <pattern>%m</pattern> </fullPatternLayout> <staticField>service_name:${serviceName}</staticField> <staticField>service_version:${serviceVersion}</staticField> <staticField>os_arch:${os.arch}</staticField> <staticField>os_name:${os.name}</staticField> <staticField>os_version:${os.version}</staticField> </layout></appender>Next, add the GELF appender to e.g. the root logger (in this example, the root logger is set to "DEBUG"):
<root level="DEBUG"> <appender-ref ref="GELF" /> <appender-ref ref="CONSOLE" /></root>Zipkin
Zipkin provides features and a centralised dashboard for service to service tracing. To install and set up Zipkin, please refer to our
Zipkin Installation documentation
.
Service to service tracing is enabled via the Spring Cloud starter Zipkin dependency:
<dependency> <groupId>org.springframework.cloud</groupId> <artifactId>spring-cloud-starter-zipkin</artifactId></dependency>Zipkin is disabled by default, to enable it remove the spring.zipkin.enabled property, or set it to true, and set the spring.zipkin.url property to the available Zipkin server (make sure to add http/https to the URL!):
spring:
  zipkin:
    enabled: false
#    baseUrl: http://localhost:9411
The % rate of traces sent to the Zipkin server is configured through the spring.sleuth.sampler.probability property, whose value can be set from 0 (0% of all traces will be sent) to 1.0 (100%). The default value is 0.1 (10%). Sleuth is disabled by default, to enable it remove the spring.sleuth.enabled property or set it to true, as for Zipkin, and set spring.sleuth.sampler.probability to the desired percentage:
spring:
  sleuth:
    enabled: false
#    sampler:
#      probability: 0.1
Be aware that service to service tracing with Zipkin is only possible when both services are communicating with each other and have Zipkin enabled.
In some cases, logs may not be enough to reveal the source of a problem. When that happens, you will have to debug your application logic.
Debugging
We do not provide an out-of-the-box solution for debugging purposes, but rely on Java and Spring Boot. As a developer, you have two options for debugging your service logic:
Debug with a local instance
You can setup a service locally and debug it in some simple steps:
-
Download your service project on your local machine.
-
Import the project into your preferred IDE.
-
Place relevant debugging breakpoint(s).
-
Run the application there in debug mode:
-
By using the Spring Tools suite.
-
By starting your Spring Boot application from your IDE via Maven (see documentation on the Spring Boot run MOJO ):
mvn spring-boot:run
-
Remote debugging
Make sure that your service project sources are up to date locally (that they match the remote instance).
You may start your application with remote debugging enabled and connect from your IDE to the remote debugging port:
-
Start your service using the Dashboard and the Executor service with the following JVM arguments to enable remote debugging (e.g. with 5005 as the port to use):
-Xdebug -Xrunjdwp:transport=dt_socket,server=y,suspend=y,address=5005Make sure that the configured remote server where your service will get deployed is accessible from your local developer machine and that the configured port is available.
You can also start the service for remote debugging locally using the Spring Boot run MOJO:mvn spring-boot:run -Dspring-boot.run.jvmArguments="-Xdebug -Xrunjdwp:transport=dt_socket,server=y,suspend=y,address=5005" -
Download your service project on your local machine.
-
Import the project into your preferred IDE.
-
Place relevant debugging breakpoint(s).
-
Configure remote debugging in your IDE:
-
Eclipse:
-
Click Run → Debug Configurations and double click on Remote Java Application.
-
Configure with the specific application host and port:
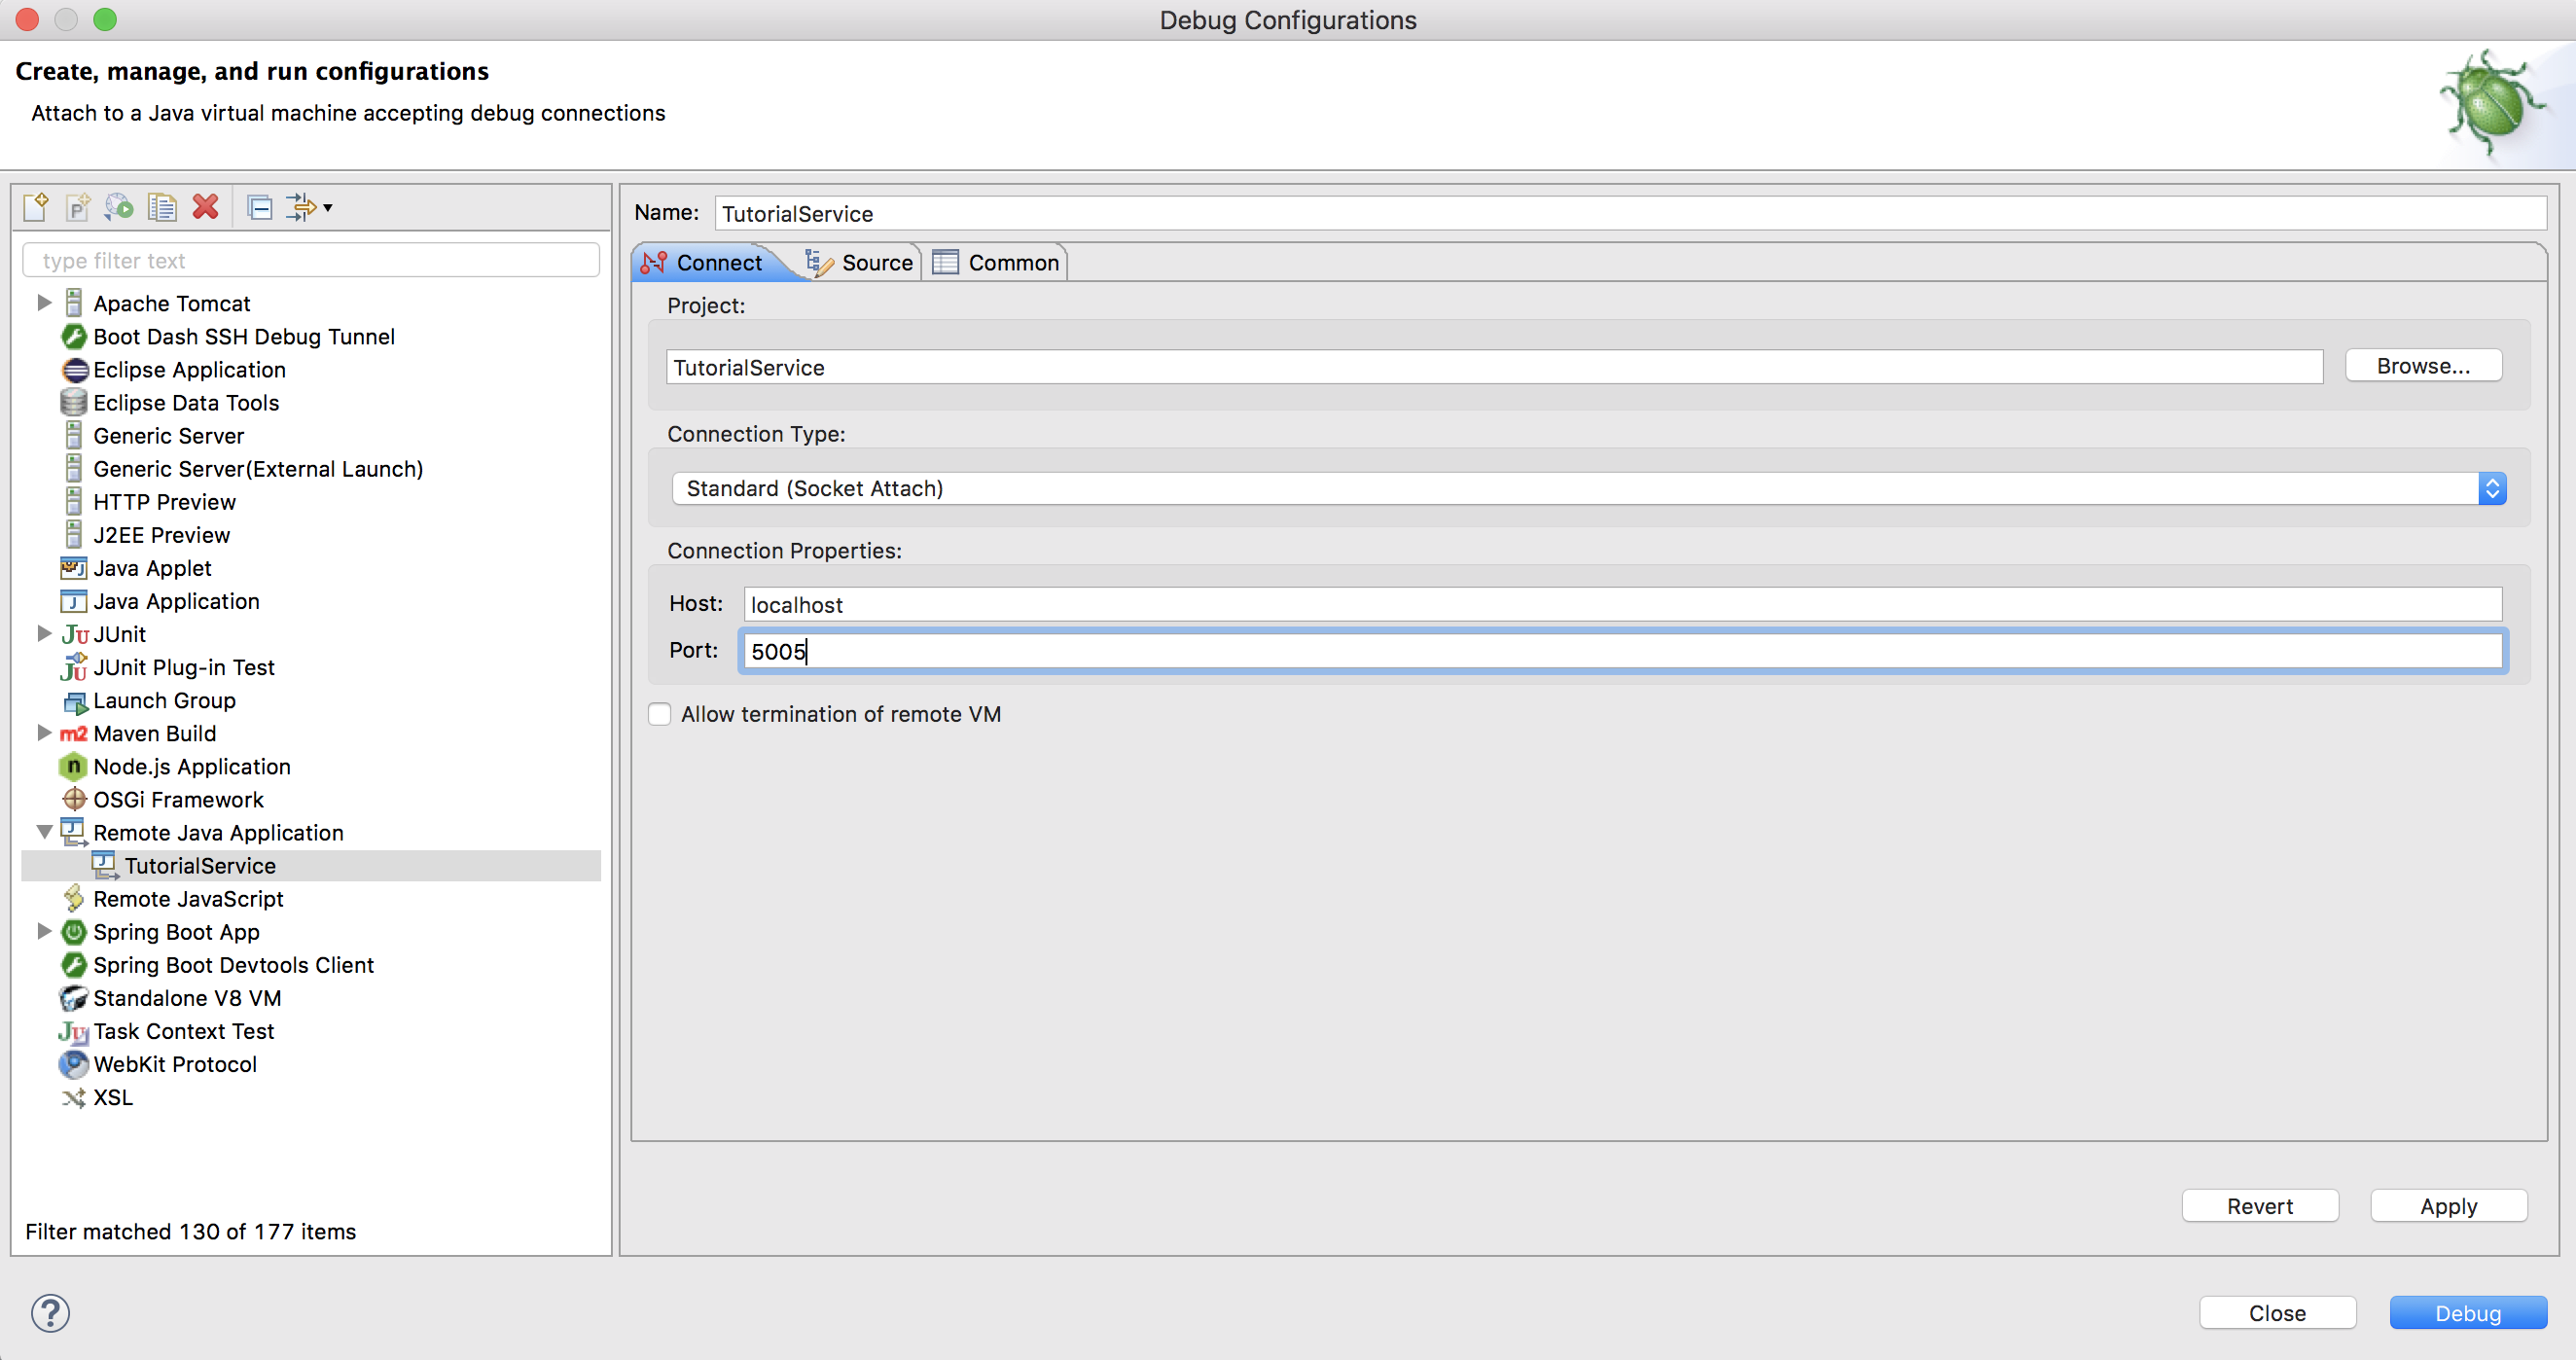
-
-
Intellij:
-
Click Run → Edit Configurations..., then click the + button in the upper left corner and select Remote from the dropdown menu.
-
Configure with the specific application host and port:

-
-
Monitor your application with Spring Boot Admin
Spring Boot Admin is a community driven open source tool that provides a dashboard to monitor your Spring Boot application by using the actuator endpoints. For more information, you can refer to its documentation .
Create a Spring Boot Admin server application
The first step is to create a simple Spring Boot Admin server project. We recommend using
Spring Initializr
to create and download a Spring Boot project with the dependency
Spring Boot Admin (Server) that you can simply import into your IDE.
You can also add the dependency manually (make sure the version matches the Spring Boot version you are using, as errors may occur if they are not identical!):
<dependency> <groupId>de.codecentric</groupId> <artifactId>spring-boot-admin-starter-server</artifactId> <version>2.0.5</version></dependency>Next, do the following:
-
Add the @EnableAdminServer annotation to the application's main class:
MyAdminServerApplication.java@SpringBootApplication@EnableAdminServerpublicclassMyAdminServerApplication{publicstaticvoidmain(String[] args){SpringApplication.run(MyAdminServerApplication.class, args);}} -
Configure the application server port and the Spring Boot Admin server URL in the application.properties file:
application.propertiesserver.port = 6699spring.boot.admin.server.url=http://localhost:8889
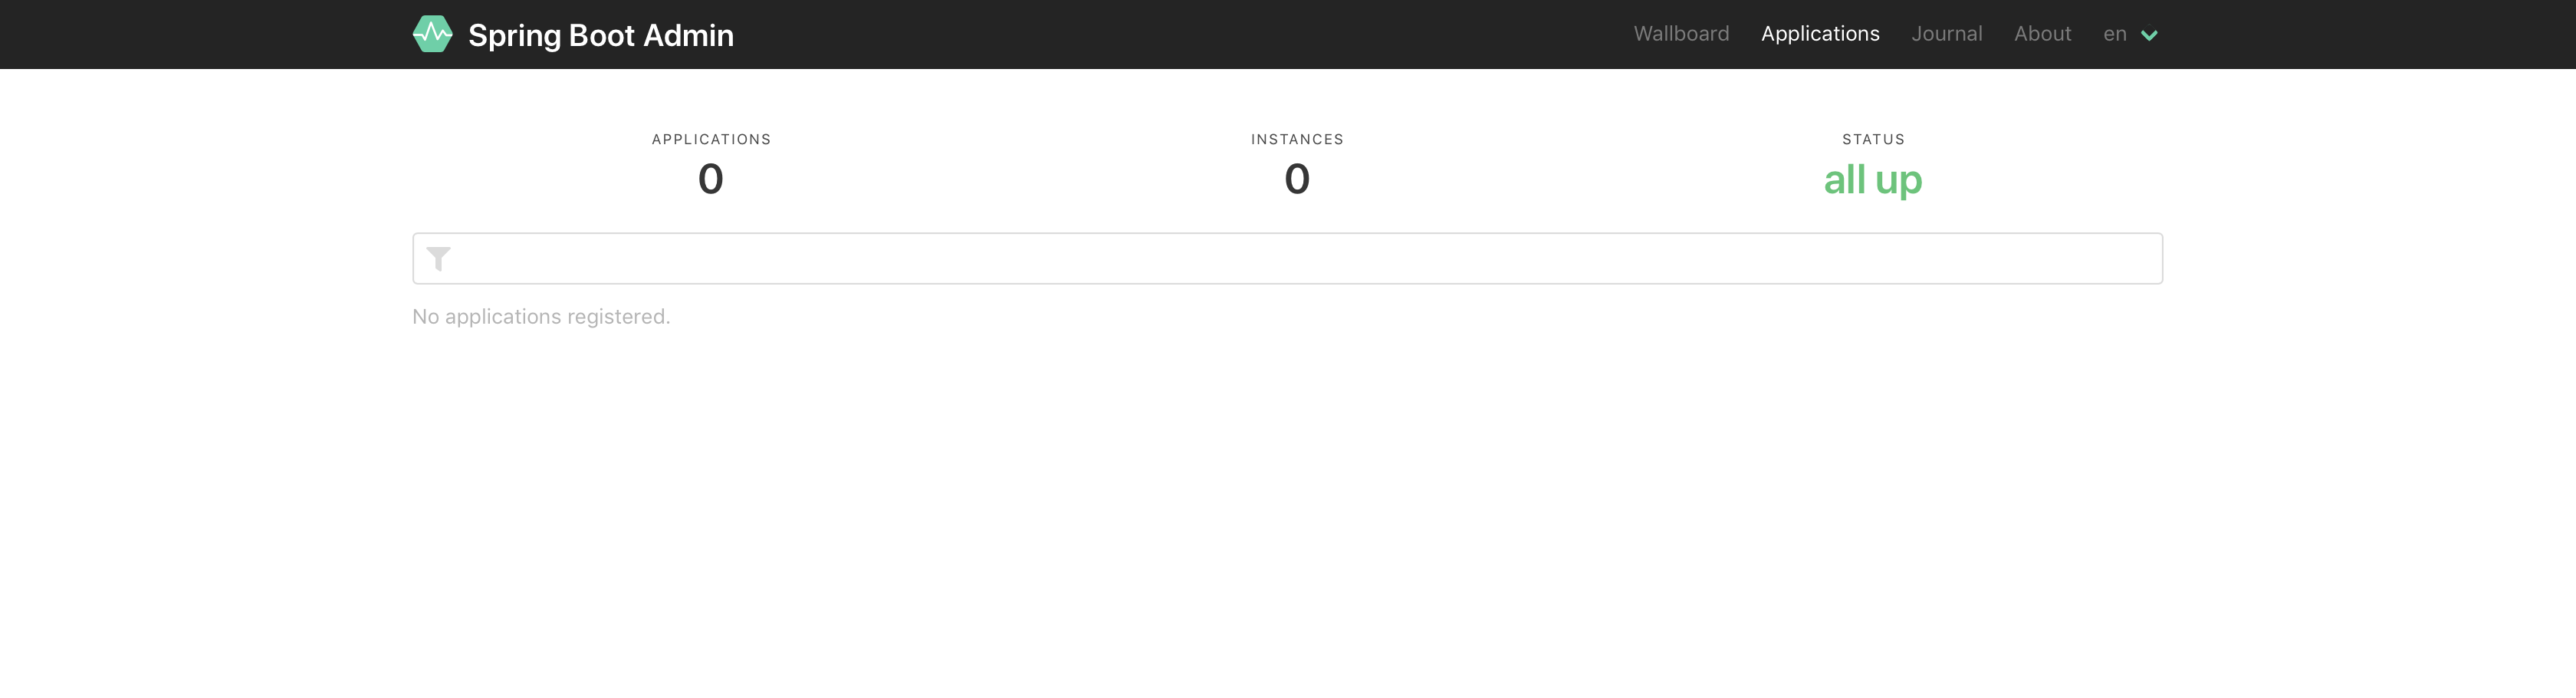
And that's all, now you can start the server and access it on e.g. http://localhost:6699:
Configure your client application
To connect your Spring Boot application and show statistics about it, the following steps have to be followed:
-
In your pom.xml, add the Spring Boot Admin client dependency (make sure the version matches the Spring Boot version you are using, as errors may occur if they are not identical!):
pom.xml<dependency><groupId>de.codecentric</groupId><artifactId>spring-boot-admin-starter-client</artifactId><version>2.0.5</version></dependency> -
Expose all actuator endpoints, so that all metrics will be shown in the Spring Boot Admin dashboard:
application.ymlmanagement: endpoints: web: exposure: include: '*'You should only expose all endpoints like this for testing purposes, NEVER in production!
In production, carefully choose which endpoints to expose. You can also use Spring Security to add security to all actuator endpoints - see here for information on how to connect Spring Boot Admin in that case). -
Add the Spring Boot Admin server URL to your properties:
application.ymlspring: boot: admin: client: url: http://localhost:6699 -
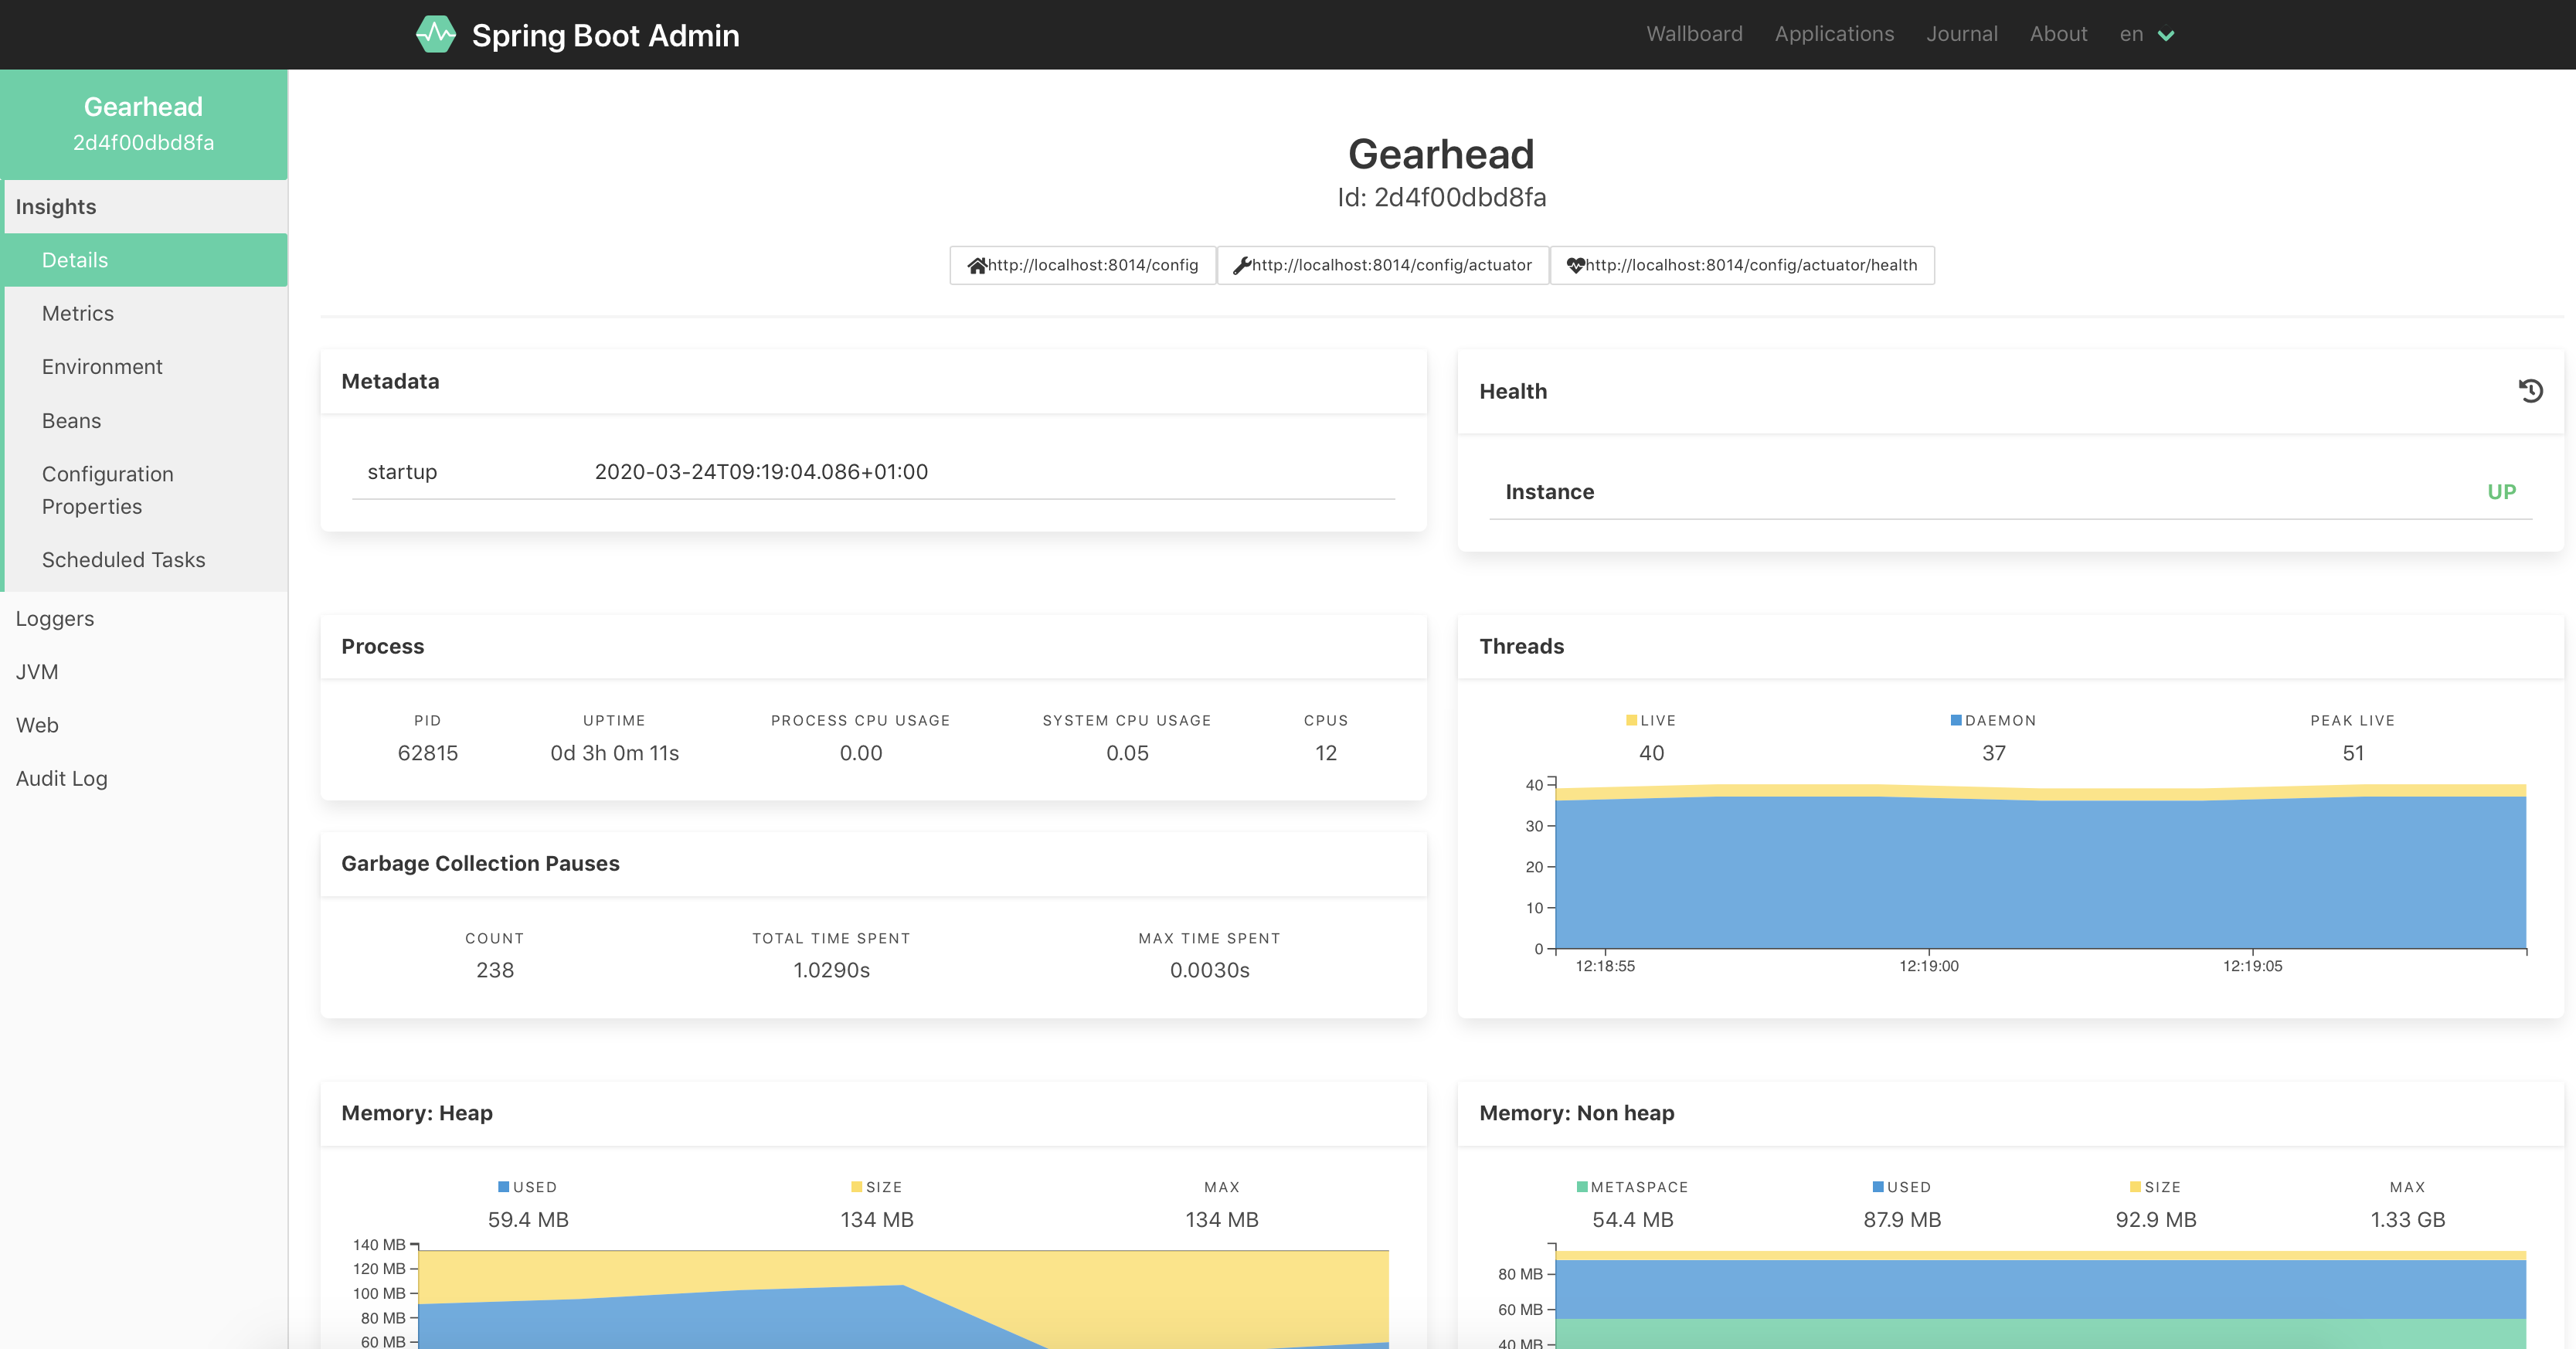
Start your service, you can now monitor it from the Spring Boot Admin dashboard (e.g. http://localhost:6699):