Drill
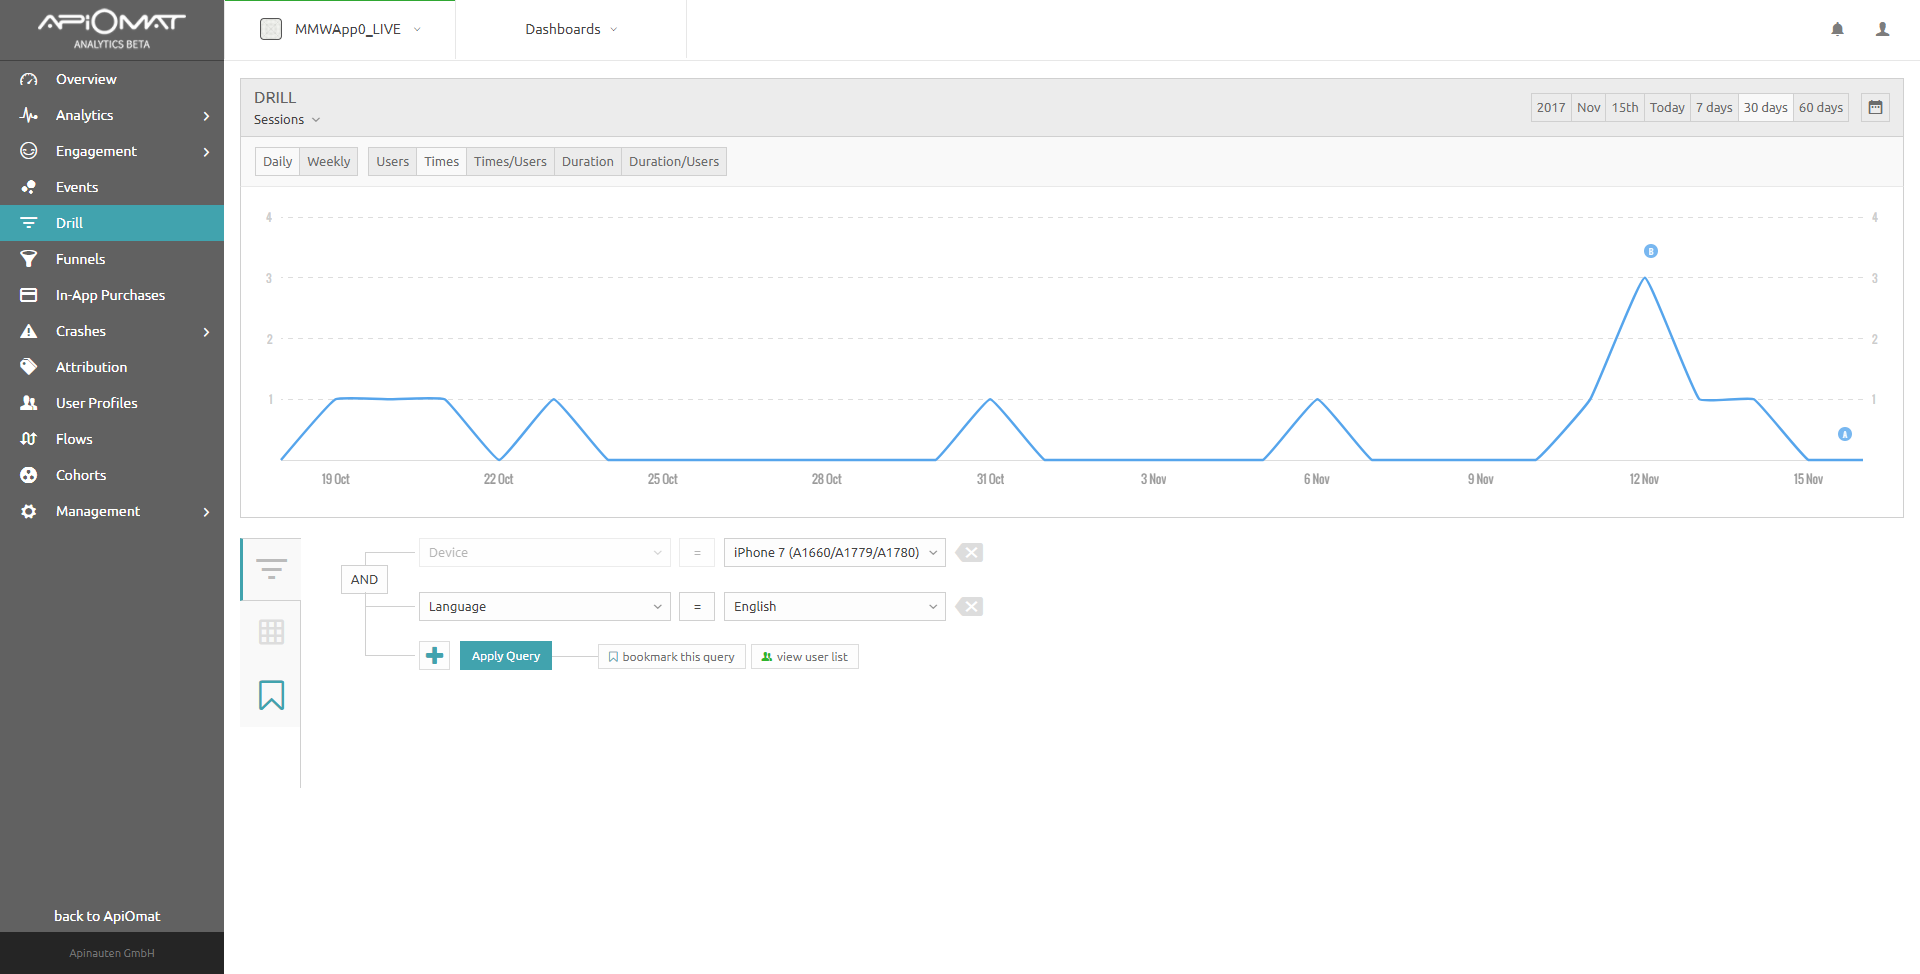
The Drill tool gives you the ability to apply advanced segmentation to your app's analytics.

At the top of the Drill page, we can select segmentations by either session, event or errors. Your selection of different data types will affect overall graph. You can define granularity (monthly/weekly/hourly/daily, depending on the selected time), or change what graph shows (e.g visitors, times or times/visitors).
With the query tool below the chart you can select filters User Properties (e.g First Seen, City, Device, Platform, Name), Custom Properties (e.g Facebook Login, Twitter name, Has Apple Watch OS etc), Campaign Properties (e.g Campaign Name).
The data can be viewed with the chart above as well as in a table. Each drill that you create can be bookmarked for later use. If you are using the User Profiles, you can also view a list of users that were the result of your query.