Logging
How to log
The native module framework offers several ways for logging.
The "model" object (and every object of the type " AbstractClientDataModel ") provides a variety of log...() methods in each hook class.
To log an error simply use for example myModelInstance.log( Level.ERROR, "Error Message", logAsync ); within your native module code.
Alternatively you can also log messages directly from module scope.
An example call is MyModule.AOM.log( Level.INFO, "My Output", logAsync );
All available logging methods have an additional boolean parameter logAsync since version 2.5, to give you the possibility to log the message asynchronously. The message will be added to a logging queue internally and a periodically running job will add these methods to the log output. Note that these messages may not be in the correct order and thus may not help you to trace a problem while developing your module, but it may improve the performance of your module. The periodical log timer will run every 30 seconds by default; this can be changed using the logTaskPeriodInSeconds setting in the config file.
Another performance improvement may be the configuration of asynchronous loggers in the log4j2.xml of your installation. You can learn more about that on log4j's offical documentation.
The following entry within the log4j2.xml defines the module logging configuration:
<Logger name="com.apiomat.backend.persistence.LogEntry" level="trace" additivity="false"> <AppenderRef ref="CONSOLE" /></Logger>In addition to the server log, the output is visible through the logging console which can be accessed in the Dashboard by clicking the  symbol in the upper right corner.
The logging level within the log4j2.xml defines which logging messages will be displayed in the logging console.
Log levels
Starting with version 3.1 all log methods have an additional parameter logLevel to control which log level should be used. The available log levels are:
-
TRACE
-
DEBUG
-
INFO
-
WARN
-
ERROR
-
FATAL
Application specific minimal log levels
As of version 3.4.2, you can configure a minimal log level. It controls which log entries are persisted in the database according to the level. Therefore, you have a better control over the number of log-related write accesses to the database, which can affect the performance of your system. The minimal level can be specified individually for each of the three systems (LIVE/STAGING/TEST). An exemplary scenario would be, that the LIVE system may only need the logs that are serious (WARN, ERROR and FATAL), the Staging system may also need the INFO level and the Test system would be set to TRACE, so that detailed debugging information is displayed.
The default value for each system is TRACE and will be used, if no configuration value was set or if the set value could not be mapped to a log level.
Example 1: Configuration via REST request on application configuration
You can retrieve and update the application configuration via the following URL: {hostBaseURL}/yambas/rest/customers/{accountName}/apps/{appName}
This can be done over the API Docs for example. The retrieved application information is in JSON format and contains the key "configuration" under which you can put additional system configurations such as the minimal log level ("app_logLevel" key).
"configuration": { "liveConfig": { "_default": { "app_logLevel": "WARN" }, "Basics": { "basics_createRole": "Guest", "basics_usersCanSeeEachOther": "true" } }, "stagingConfig": { "_default": { "app_logLevel": "INFO" }, "Basics": { "basics_createRole": "Guest", "basics_usersCanSeeEachOther": "true" } }, "testConfig": { "_default": { "app_logLevel": "TRACE" }, "Basics": { "basics_createRole": "Guest", "basics_usersCanSeeEachOther": "true" } }},
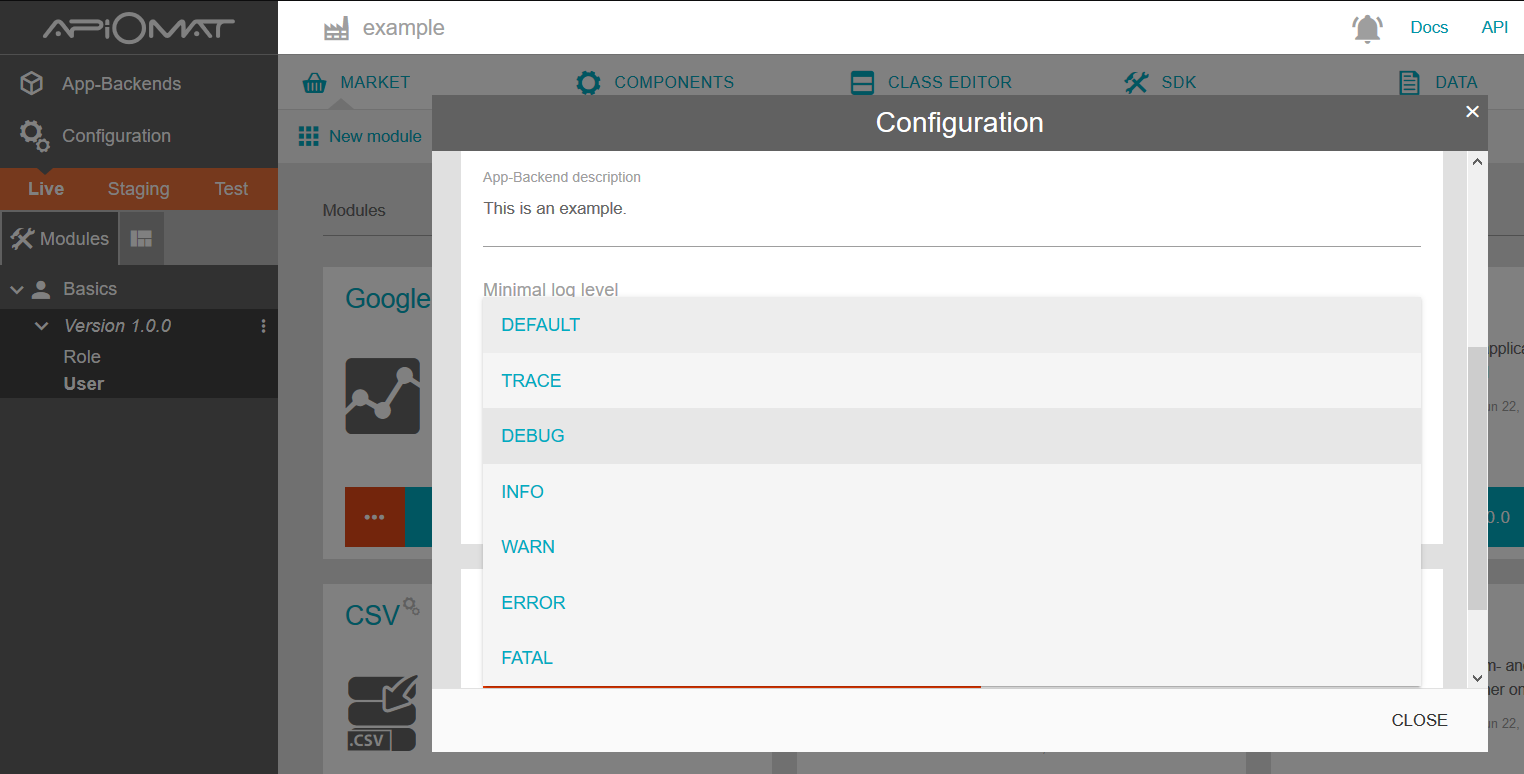
Example 2: Configuration via dashboard
You can find the application configuration on in the navigation bar on the left. When you click on the configuration, a modal opens, where you can change the log level.
Further note
Besides the development with log outputs there is the possibility of remote debugging.