Counting Requests for ApiOmat App Backends
With the new request count feature, you can easily count the requests for App-Backends in ApiOmat. The feature is available since ApiOmat Dispatcher 1.9.0
The dispatcher service will collect the data that are necessary to get an overview over the usage of your app backends. If configured, it will periodically push the request statistics for a specific timeframe to the InfluxDB. The database will contain information about the requested app backend, the response code and the number of requests for that app backend and response code within the specified timeframe.
Additional Requirements
Aside from the general setup for ApiOmat, including especially the Dispatcher and Yambas, you'll need the following additional components:
-
InfluxDB (required, to store the metrics data)
-
Grafana (optionally, to visualize the data; if you use Influx DB v2 you can also use this UI to visualize your data)
Configuration
Now lets set up each component.
Dispatcher Configuration
In the application.yml of Dispatcher you need to configure:
# enable metrics collection in dispatcher
dispatcher:
  metrics:
    appcount:
      enable: true
# configure InfluxDB connection
management:
  metrics:
    enable:
# disable the metrics that are pushed by default (omit this part or set values to true if you want to publish and use them )
      jvm: false
      processor: false
      process: false
      system: false
      logback: false
      http: false
      spring: false
    export:
      influx:
        step: 15s
        uri: https://localhost:8086
# InfluxDB v1 configuration
        db: appcount
        userName: myuser
        password: my-password
# InfluxDB v2 configuration
        bucket: appcount
        org: myorg
        token:
Grafana with InfluxDB 1.x
Configure the data source
Now you can log in to the admin dashboard of Grafana and set up the dashboard.
-
Go to the configuration panel and select "Data sources"
-
Choose "Add Data source" and select "InfluxDB"
-
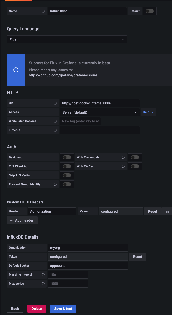
Select "InfluxQL" as Query Language and configure the connection to the database, it should be nearly the same as in your application.yml
Your datasource configuration should look like this:
Configure a dashboard
-
Log in to the Grafana Dashboard, you can see the "Create your first dashboard" panel. Click it to create a new dashboard.
-
Give your dashboard a nice name over the dashboard settings and then click the "Add an empty panel" button.
-
Enter a name for the panel by setting a Title in the Panel options and switch to the raw query mode by clicking on the pencil button in the query area at the left bottom to enter an InfluxQL Query
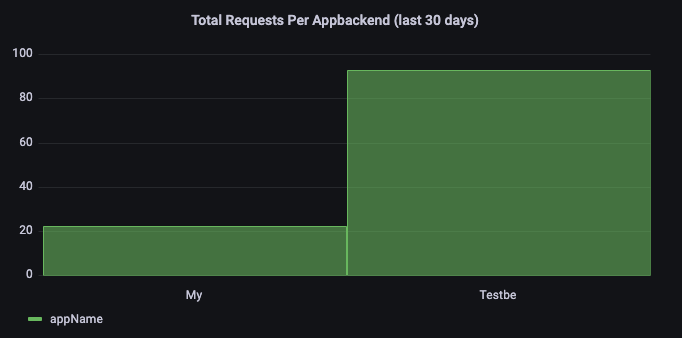
An example for a InfluxQL Query is the following one. The result will show you a table with entries representing the sum of requests over the selected time frame, grouped by the names of your app backend, which can be easily visualised as Bar chart:SELECT sum("value") as request_count FROM"aom_appcount"WHERE $timeFilter GROUP BY"appName"The resulting chart could look like this:
Grafana with InfluxDB 2.x
Configure the data source
A description for the configuration can be found in the InfluxDB 2.0 Documentation. It shows the steps for the configuration with "Flux" as well as "InfluxQL" as query language.
Basically the steps for the configuration with "Flux" as query language are:
-
Go to the configuration panel and select "Data sources"
-
Choose "Add Data source" and select "InfluxDB"
-
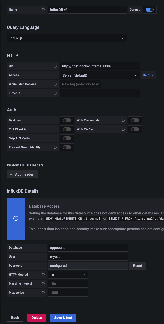
Select "Flux" as Query Language and configure the connection to the database, it should be nearly the same as in your application.yml, you'll need to disable the Basic authentication and configure a custom "authentication" header with "Token " + <your API token> as value. (See here how you can create an API token in your InfluxDB)
Your datasource configuration should look like this:
For a setup with InfluxQL you'll need to configure InfluxDBv1 authorizations and DBRP mappings over the influx command line tool. Take a look at the documentation for setup.
Configure a dashboard
-
Log in to the Grafana Dashboard, you can see the "Create your first dashboard" panel. Click it to create a new dashboard.
-
Give your dashboard a nice name over the dashboard settings and then click the "Add an empty panel" button.
-
Enter a name for the panel by setting a Title in the Panel options and switch to the raw query mode by clicking on the pencil button in the query area at the left bottom to enter an InfluxQL Query
An example for a InfluxQL Query is the following one. The result will show you a table with entries representing the sum of requests over the selected time frame, grouped by the names of your app backend, which can be visualised as Bar chart:SELECT sum("value") as request_count FROM"aom_appcount"WHERE $timeFilter GROUP BY"appName"
Influx DB 2.x UI
Configure a dashboard
-
Log in to the Influx DB UI, you can see the "Build a Dashboard" button. Click it and select "Create Dashboard" → "New Dashboard" to create a new dashboard.
-
Give your dashboard a nice name and then click the "Add Cell" button.
-
Enter a name for the cell and switch to the "Script Editor" to enter a Flux Query (note: you may need to adjust the bucket name to the one you specified within the application.yml)
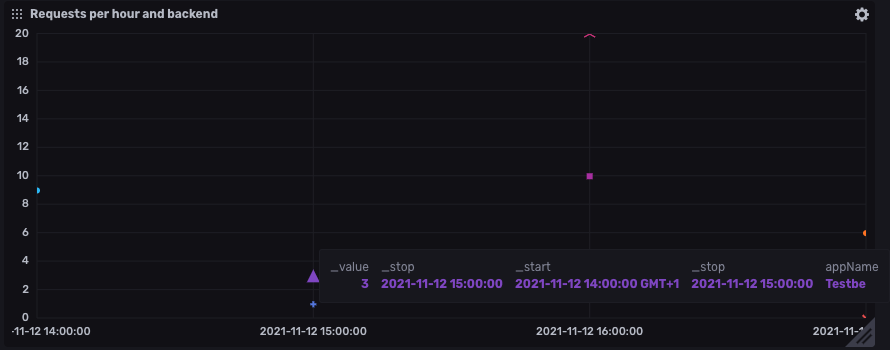
An example for a Flux Query is the following one. The result will show you a table with entries representing the number of requests in hourly ranges and grouped by the names of your app backend, which can be easily visualised as Scatter plot:Flux Queryfrom(bucket:"appcount")|> range(start: v.timeRangeStart, stop: v.timeRangeStop)|> group(columns: ["appName"])|> window(every: 1h)|> sum(column:"_value")|> map(fn: (r) => ({ r with requests: r._value }))The resulting chart could look like this: